Anthophyllite — FTIR1,801 points · 400–4000 cm⁻¹
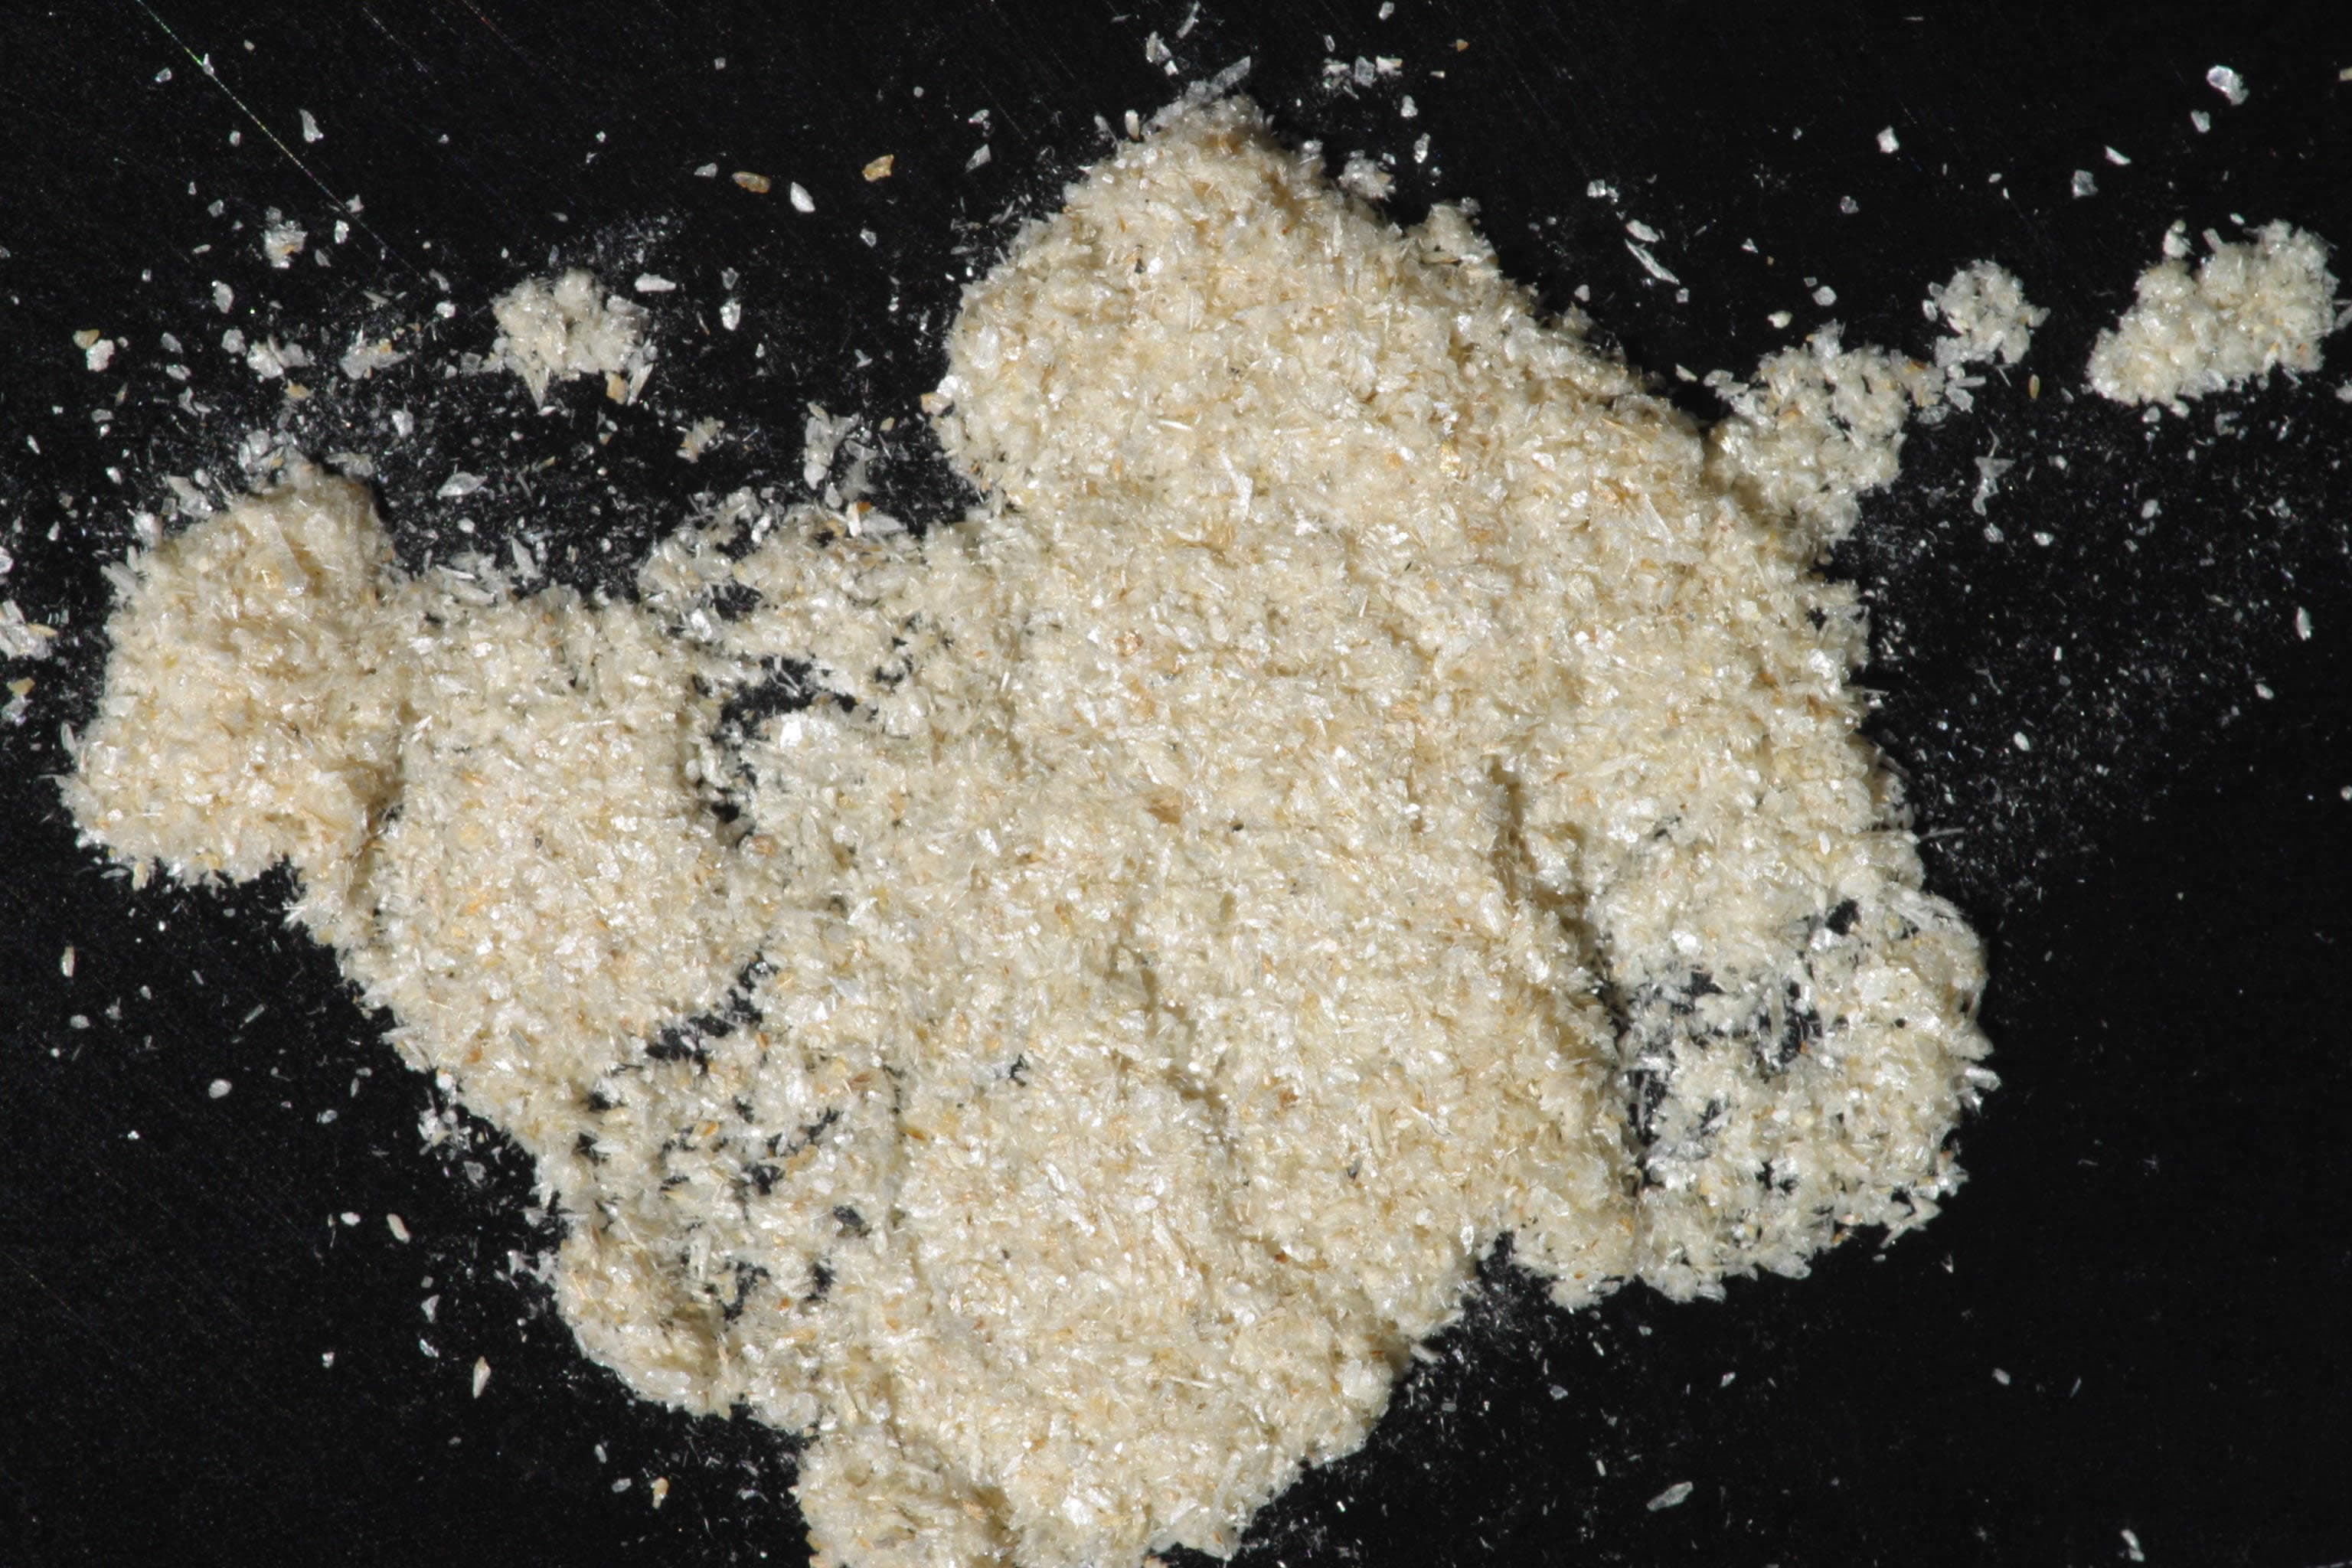
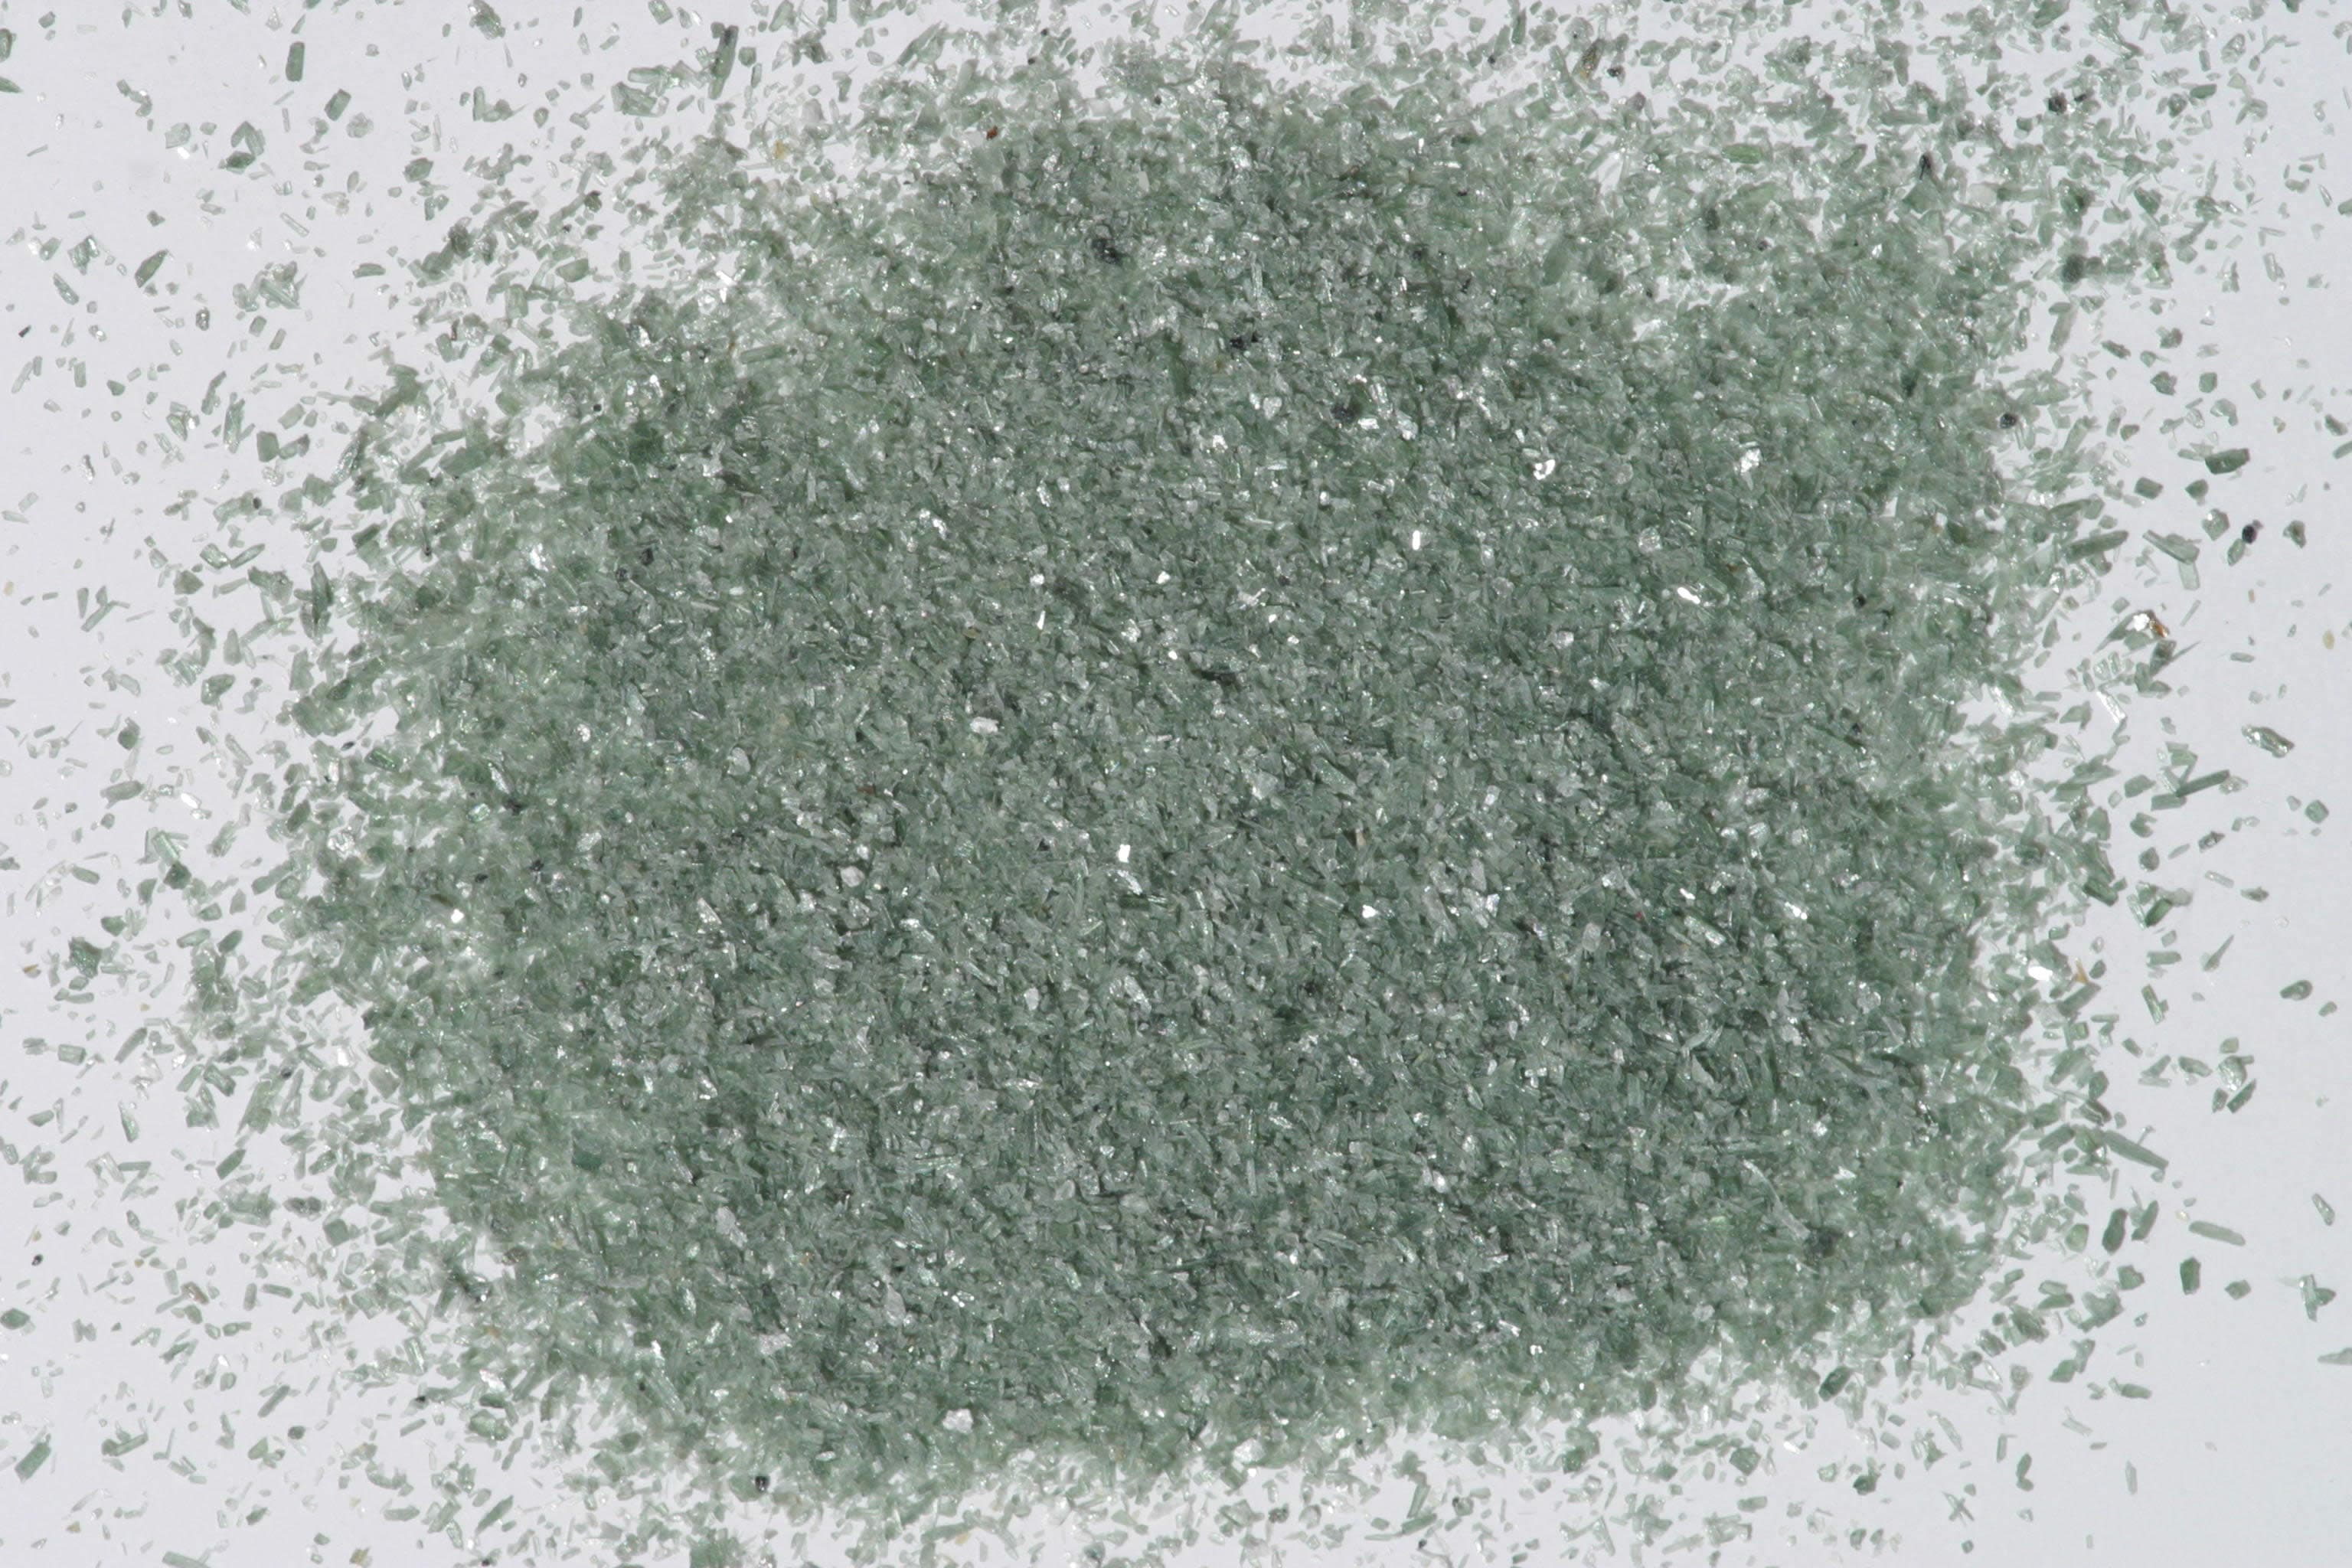
Sample photograph — USGS Spectral Library v7
Spectrum Details
- Modality
- FTIR
- Category
- mineral
- Material Type
- Inosilicate
- Sample ID
- HS286.1B, HS286.2B, HS286.3B, HS286.4B
- Collection Locality
- North Carolina
- Spectral Purity
- 1c2_3_4_ # HS286.1B # 1= 0.2-3, 2= 1.5-6, 3= 6-25, 4= 20-150 microns SPECTRAL_PURITY: 1c2_3_4_ # HS286.2B # 1= 0.2-3, 2= 1.5-6, 3= 6-25, 4= 20-150 microns SPECTRAL_PURITY: 1c2d3d4_ # HS286.3B # 1= 0.2-3, 2= 1.5-6, 3= 6-25, 4= 20-150 microns SPECTRAL_PURITY: 1c2_3_4_ # HS286.4B # 1= 0.2-3, 2= 1.5-6, 3= 6-25, 4= 20-150 microns
- Composition / XRD
- None # XRF, EPMA, ICP(Trace), WChem
- Sample Description
- Forms series with Magnesio-anthophyllite and Ferro-anthophyllite. Spectra for this sample were originally published in: Hunt, G.R., J.W. Salisbury, and C.J. Lenhoff, 1973, Visible and near-infrared spectra of minerals and rocks: VI. Additional silicates. Modern Geology, v. 4, p. 85-106. With the note: "The dominant feature in its spectrum is the very well defined band at 0.95µm due to Fe^+2 in the octahedral site, and this is accompanied by bands at 0.375, 0.475 and 0.65µm. The very weak 0.65µm band indicates the presence of a very little ferric iron which enters the mineral when aluminum substitutes for silicon. Bands at 1.4, 2.32, and 2.4µm are all due to the OH vibrations, and there is a complete absence of evidence for molecular H2O." Sample measured for the library was the 74-250µm sieve interval, 3B. Hunt and others also noted some magnetite contamination, but with the high reflectance level at 1.6 µm it must be very low. Roger N. Clark Grain size fractions are indicated by the extension after the sample number: .1B = IMAGE_OF_SAMPLE:
- XRD Analysis
- 40 kV - 30 mA, 6.5-9.5 keV File: anth286_mdi, *.out (smear mount on quartz plate) References: Huebner's reference patterns; PDF2 #12-0242 21-1227; HS-286.3B (anth286b_MDI and anthp286_MDI) Found: Talc, anthophyllite, minor 14 Angstroms-chlorite, possible trace of mica Comment: Talc peaks are strong and the basal reflections are very sharp; resolution of the alpha1-alpha2 reflections is good. Amphibole peaks are much less intense but sharp. Theses phases appear homogeneous in composition and well crystallized. The amphibole is orthorhombic and its pattern is consistent with that of anthophyllite. (Comparison and random and smear mounts proves that talc is the dominant phase.) A minor chlorite phase displayed basal spacing's consistent with chamosite 1M or clinochlore 1M. A trace of mica (reflection at 10.4 Angstroms) could not be further characterized. Very weak un indexed reflections at 8.6 and 7.4 Angstroms. Very fine-grained sample. 40 kV -30 mA, 6.5-9.5 keV File: anthp286_mdi, *.out (smear mount of 3B on quartz plate) anth286b_mdi, *.out (edge/random mount of 3B) anth286_mdi, *.out (smear mount of ground 4B) References: JCPDS #13-558; Borg and Smith (1969); Huebner's reference patterns Found: Talc, subordinate orthoamphibole, minor chlorite, trace mica (?), un indexed reflections of a minor phase(s) at 7.4 Angstroms (weak intensity), 4.55 (strong, broad) 3.56 (medium), 2.63 (medium, broad), 2.49 (strong, broad), 2.45 (medium, broad), 2.23 (medium weak, broad), 1.42 (weak, broad) Comment: Orthoamphibole pattern is consistent with anthophyllite or gedrite, but not with holmquistite. Chlorite identification based on three basal reflections; mica based on one basal reflection in a smear mount (this reflection is absent in a random mount). HS-286.3B extremely fine grained, like talcum powder; HS-286.4B is coarse but the grains are soft. Talc and chlorite reflections are sharp, suggesting good crystallinity. The orthoamphibole and the unidentified reflections are of variable sharpness.
- X Units
- cm⁻¹
- Y Units
- Absorbance
- Data Points
- 1,801
Download
Attribution
USGS Spectral Library Version 7, U.S. Geological Survey
License: Public Domain
DOI: 10.3133/ds1035Analyze in Workbench
Open this spectrum in the SpectralBench workbench for advanced analysis, peak detection, and comparison.
Open Workbench