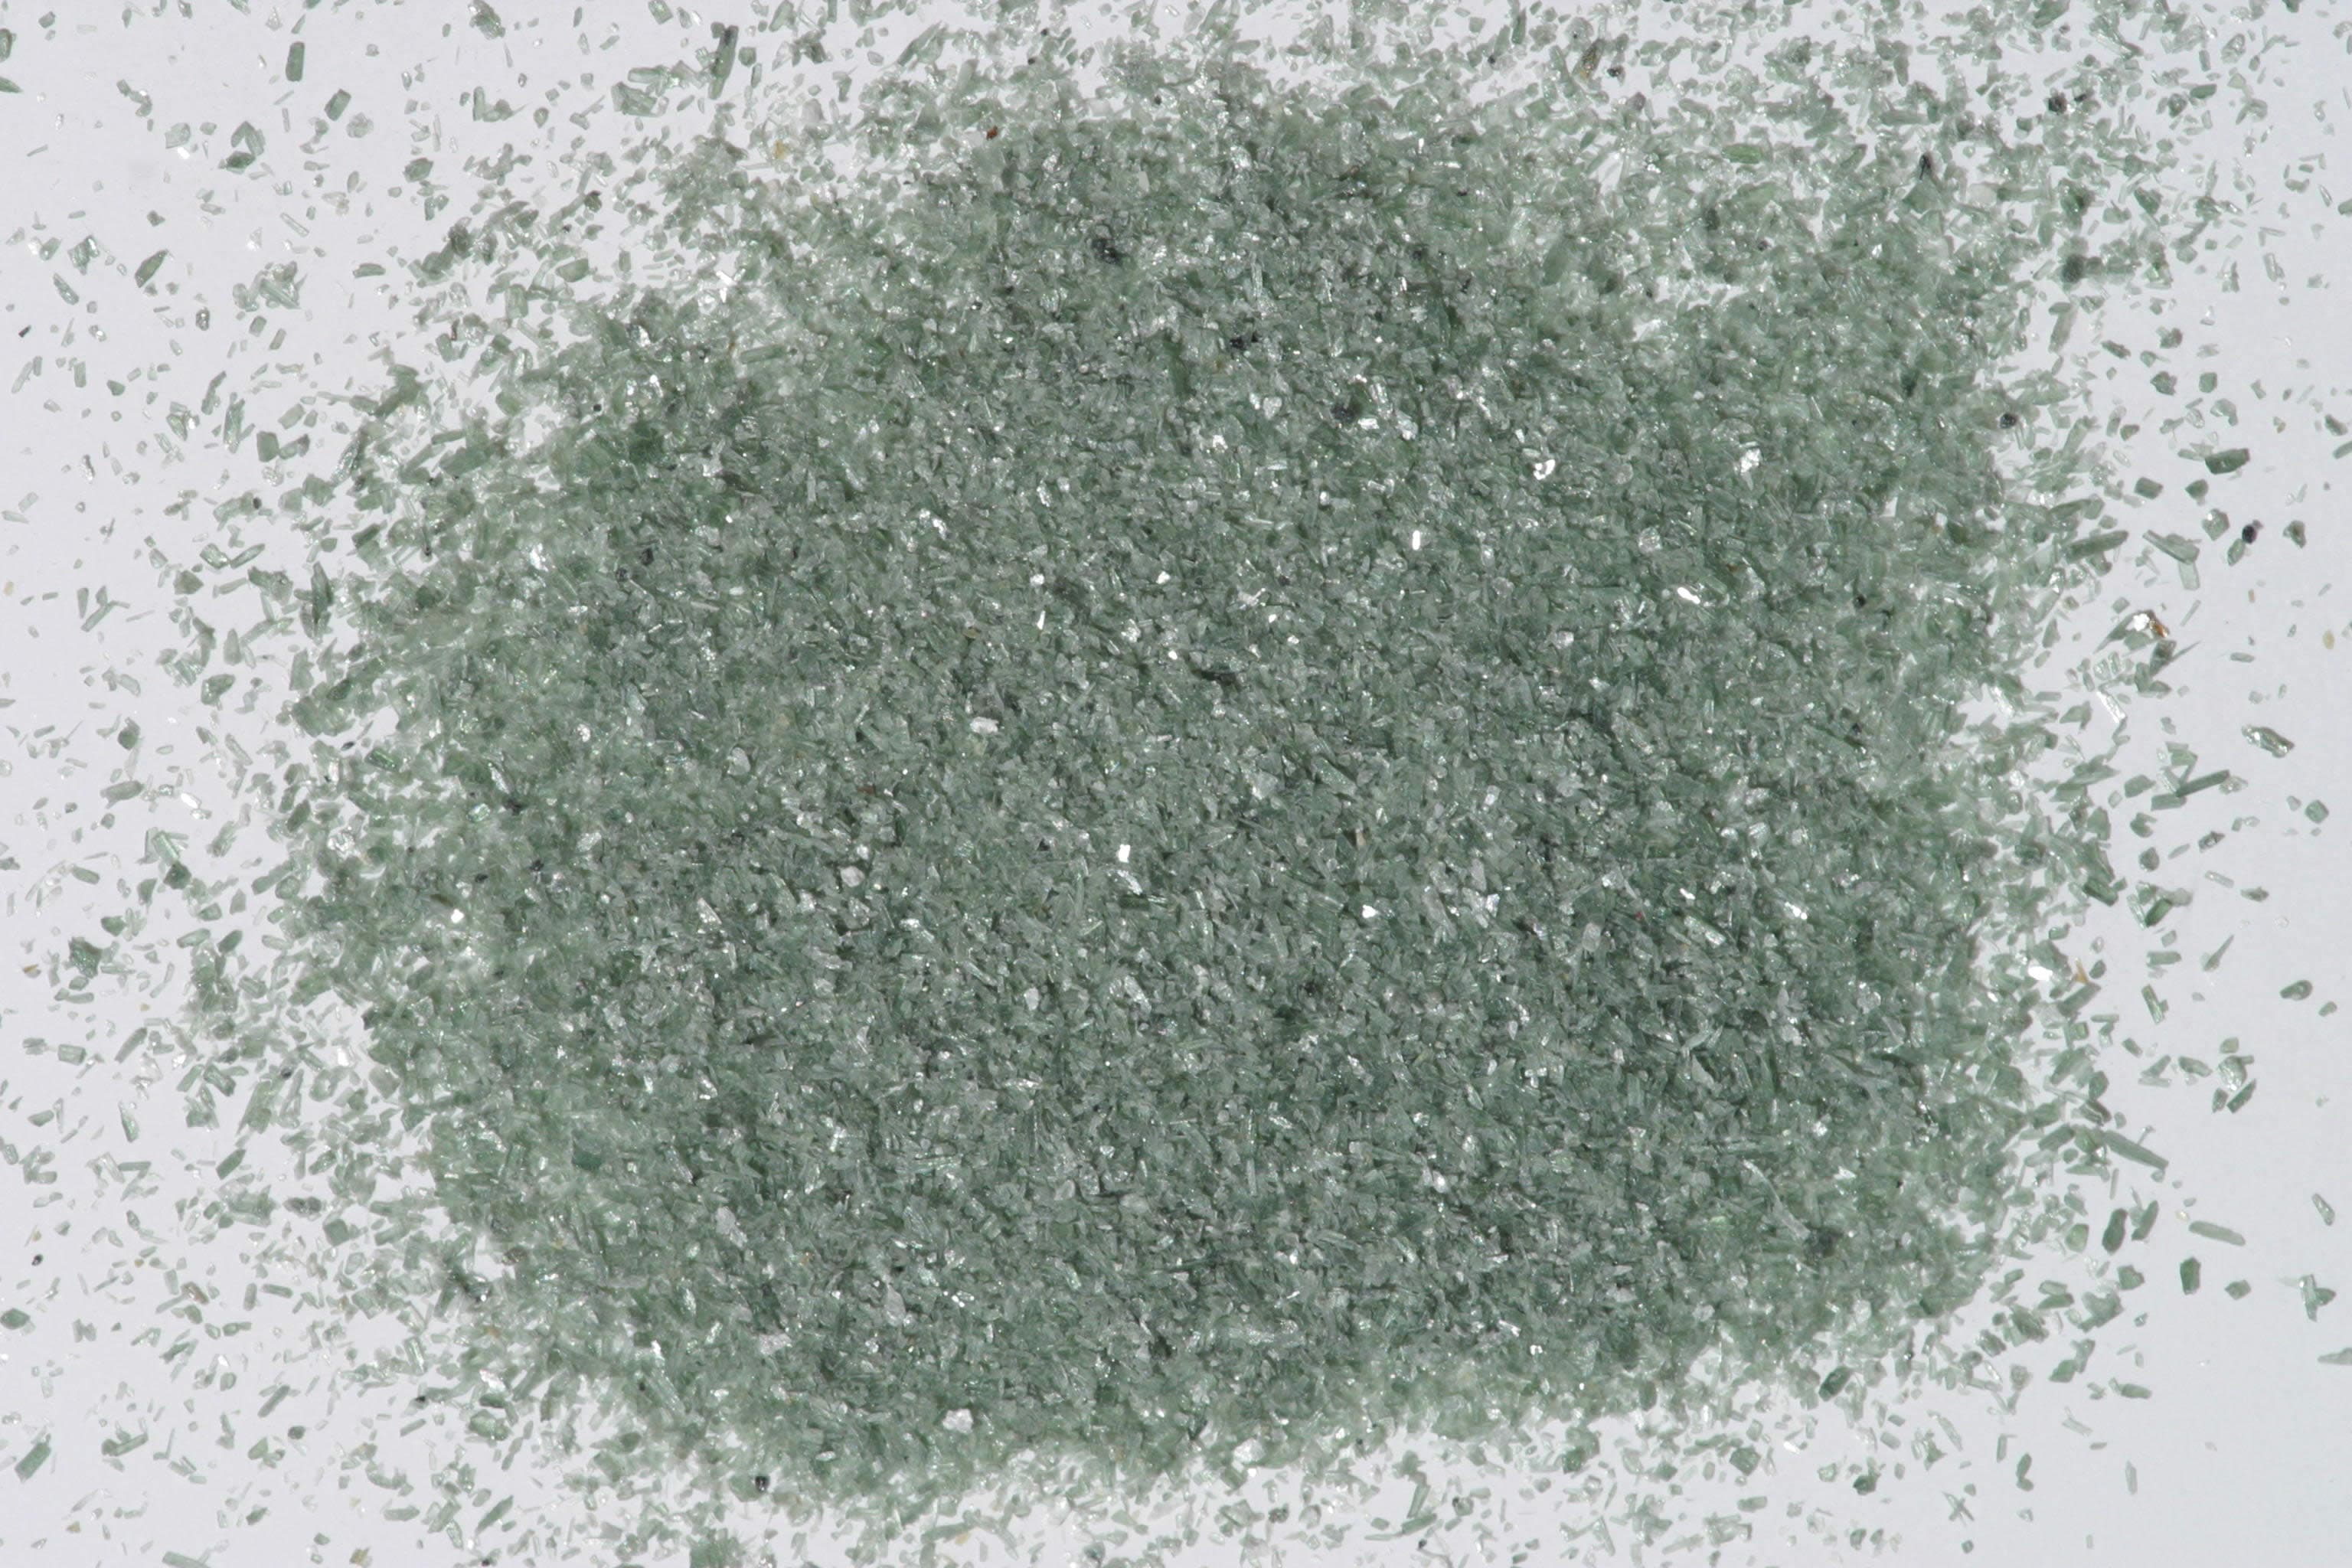
Biotite — FTIR1,801 points · 400–4000 cm⁻¹
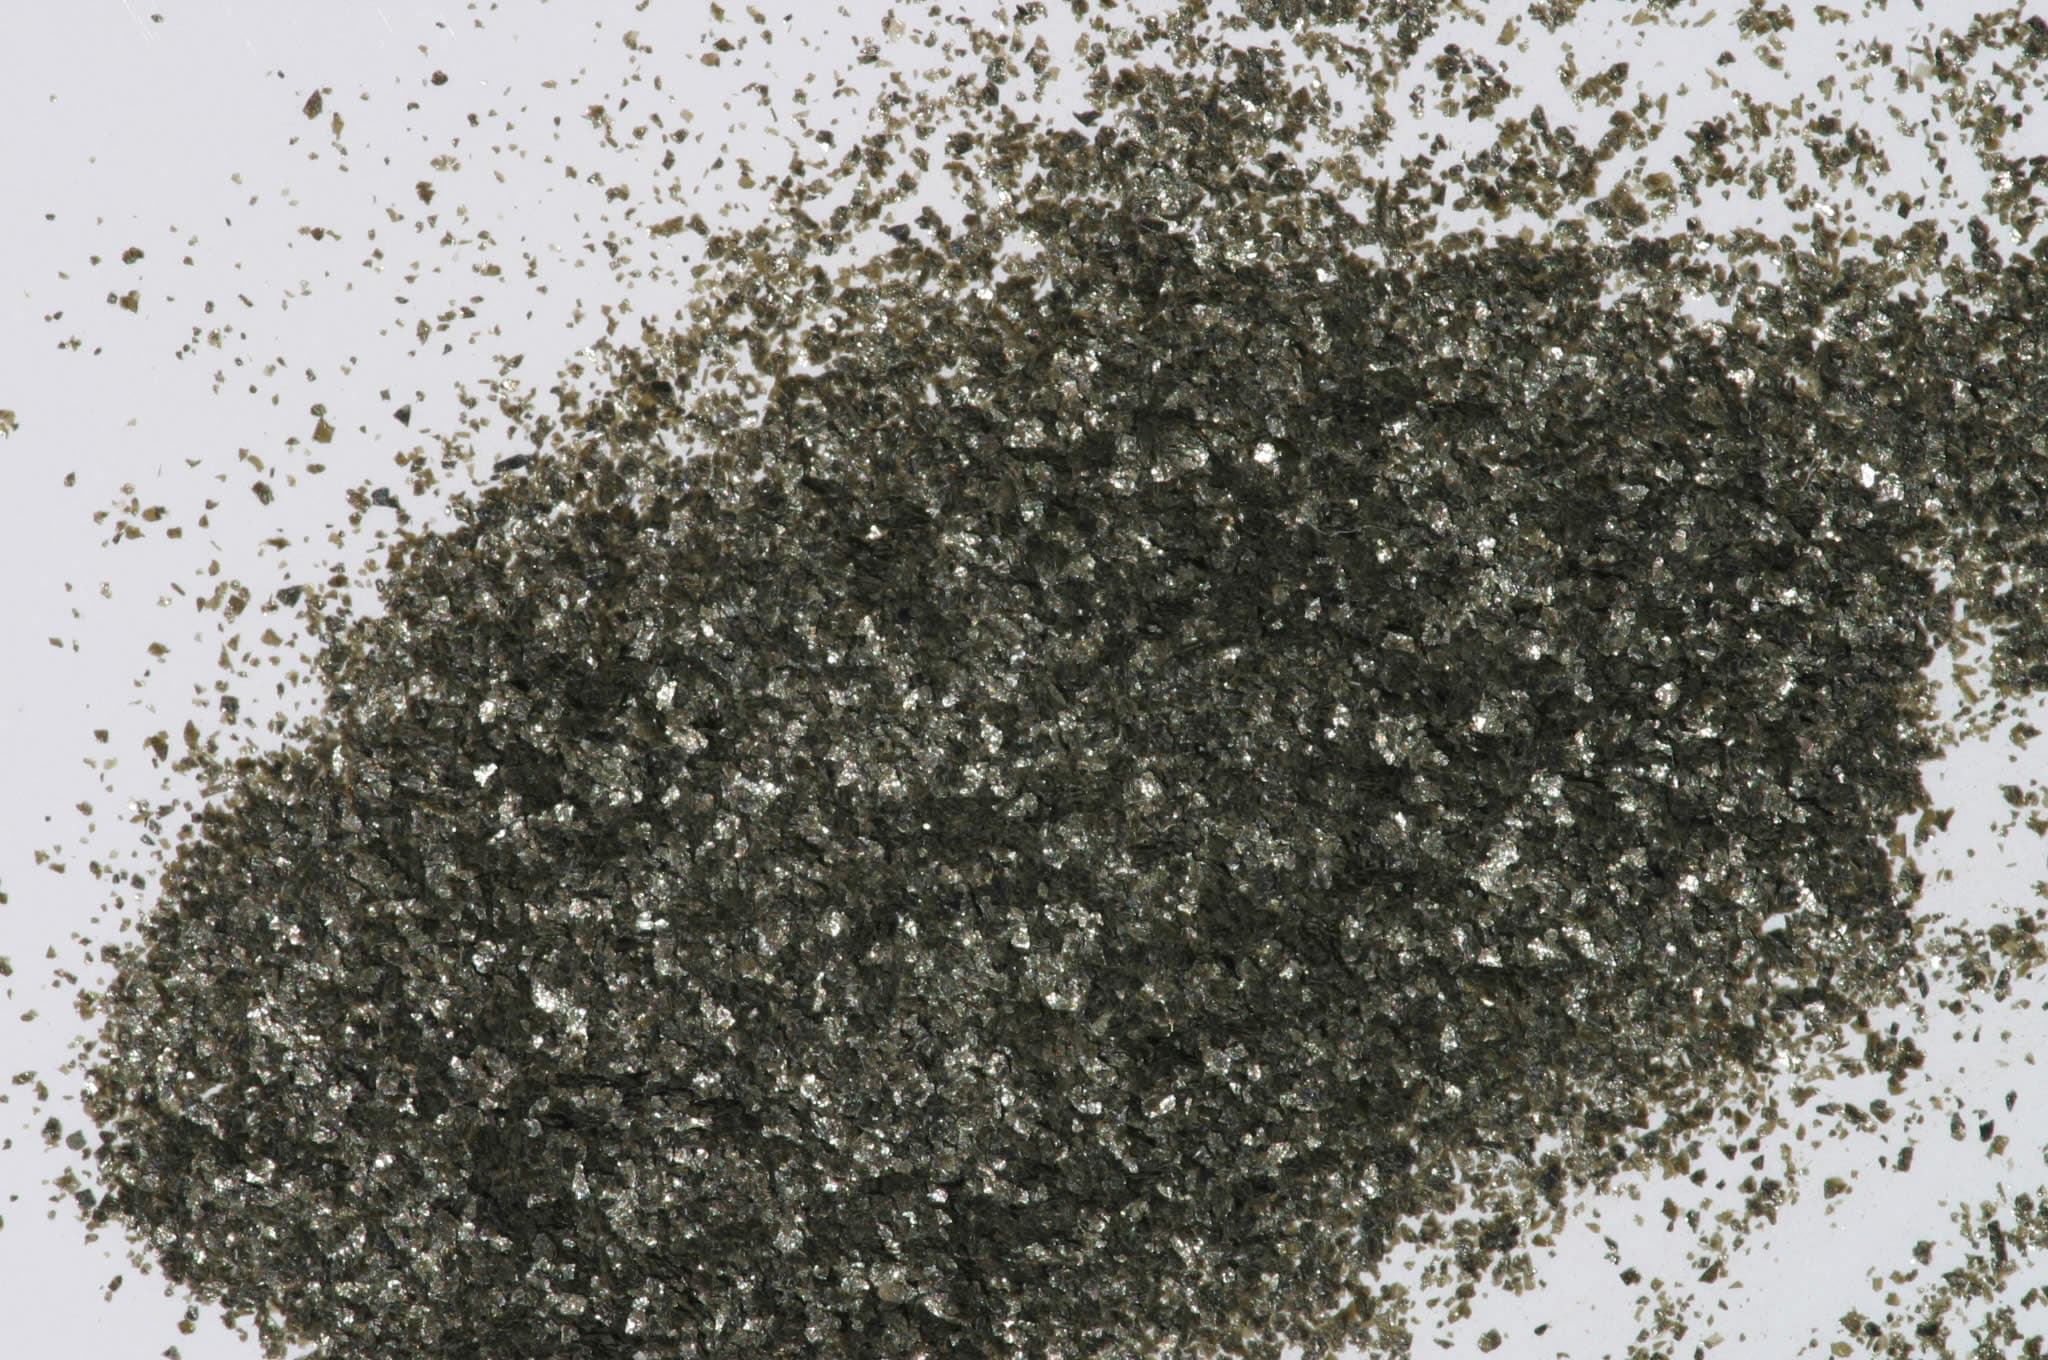
Sample photograph — USGS Spectral Library v7
Spectrum Details
- Modality
- FTIR
- Category
- mineral
- Material Type
- Phyllosilicate
- Sample ID
- HS28.3B
- Collection Locality
- Ontario
- Spectral Purity
- 1a2a3a4a # 1= 0.2-3, 2= 1.5-6, 3= 6-25, 4= 20-150 microns
- Composition / XRD
- EM(WDA) # XRF, EPMA, ICP(Trace), WChem
- Sample Description
- Forms series with Phlogopite. Usually in irregular foliated masses. Composition is similar to phlogopite but with considerable substitution of Fe^+2 for Mg. There is also substitution by Fe^+3 and Al for Mg and by Al for Si. In addition a series exists between phlogopite and biotite. The trioctahedral biotite structure is the same as that of phlogopite. "S-5. Biotite. Bancroft, Ontario (28). A potassium magnesium-iron-aluminum silicate, essentially K(Mg,Fe)3AlSi3O10(OH)2. Biotite is a widely distributed accessory mineral in igneous rocks and also occurs in some metamorphic rocks. Ferrous and ferric ions cause a very broad band in the 0.6 to 1.5µm region, and the drop-off in the blue. Hydroxyl bands are barely observable in the spectra. There are several possible reasons for the lack of observable OH overtones in this spectrum: The OH groups are commonly oriented (because the mica flakes lie on their cleavage faces) so that the observation angle may preclude their observation in the spectrum; the fundamental OH stretch is normally much broader in biotite than in other micas; and the OH concentration in this sample may be particularly low, because the OH in biotite may be readily replaced by F, Na, Fe^+2 etc." Sieve interval 74 - 250µm. Hunt, G.R., J.W. Salisbury, 1970, Visible and near-infrared spectra of minerals and rocks: I. Silicate minerals. Modern Geology, v. 1, p. 283-300. IMAGE_OF_SAMPLE:
- XRD Analysis
- N. Vergo: Biotite plus trace other (pre 1990). New analysis by Steve Sutley, September, 2003 shows this is a pure titanium biotite. Thus, the spectral purity is raised from b to a. Clark, R.N., King, T.V.V., Klejwa, M., Swayze, G.A., and Vergo, N., 1990, High spectral resolution reflectance spectroscopy of minerals: Journal of Geophysical Research, v. 95, no. 8B, p 12,653-12,680.
- X Units
- cm⁻¹
- Y Units
- Absorbance
- Data Points
- 1,801
Download
Attribution
USGS Spectral Library Version 7, U.S. Geological Survey
License: Public Domain
DOI: 10.3133/ds1035Analyze in Workbench
Open this spectrum in the SpectralBench workbench for advanced analysis, peak detection, and comparison.
Open Workbench