ClinozoisiteEpidote — FTIR1,801 points · 400–4000 cm⁻¹
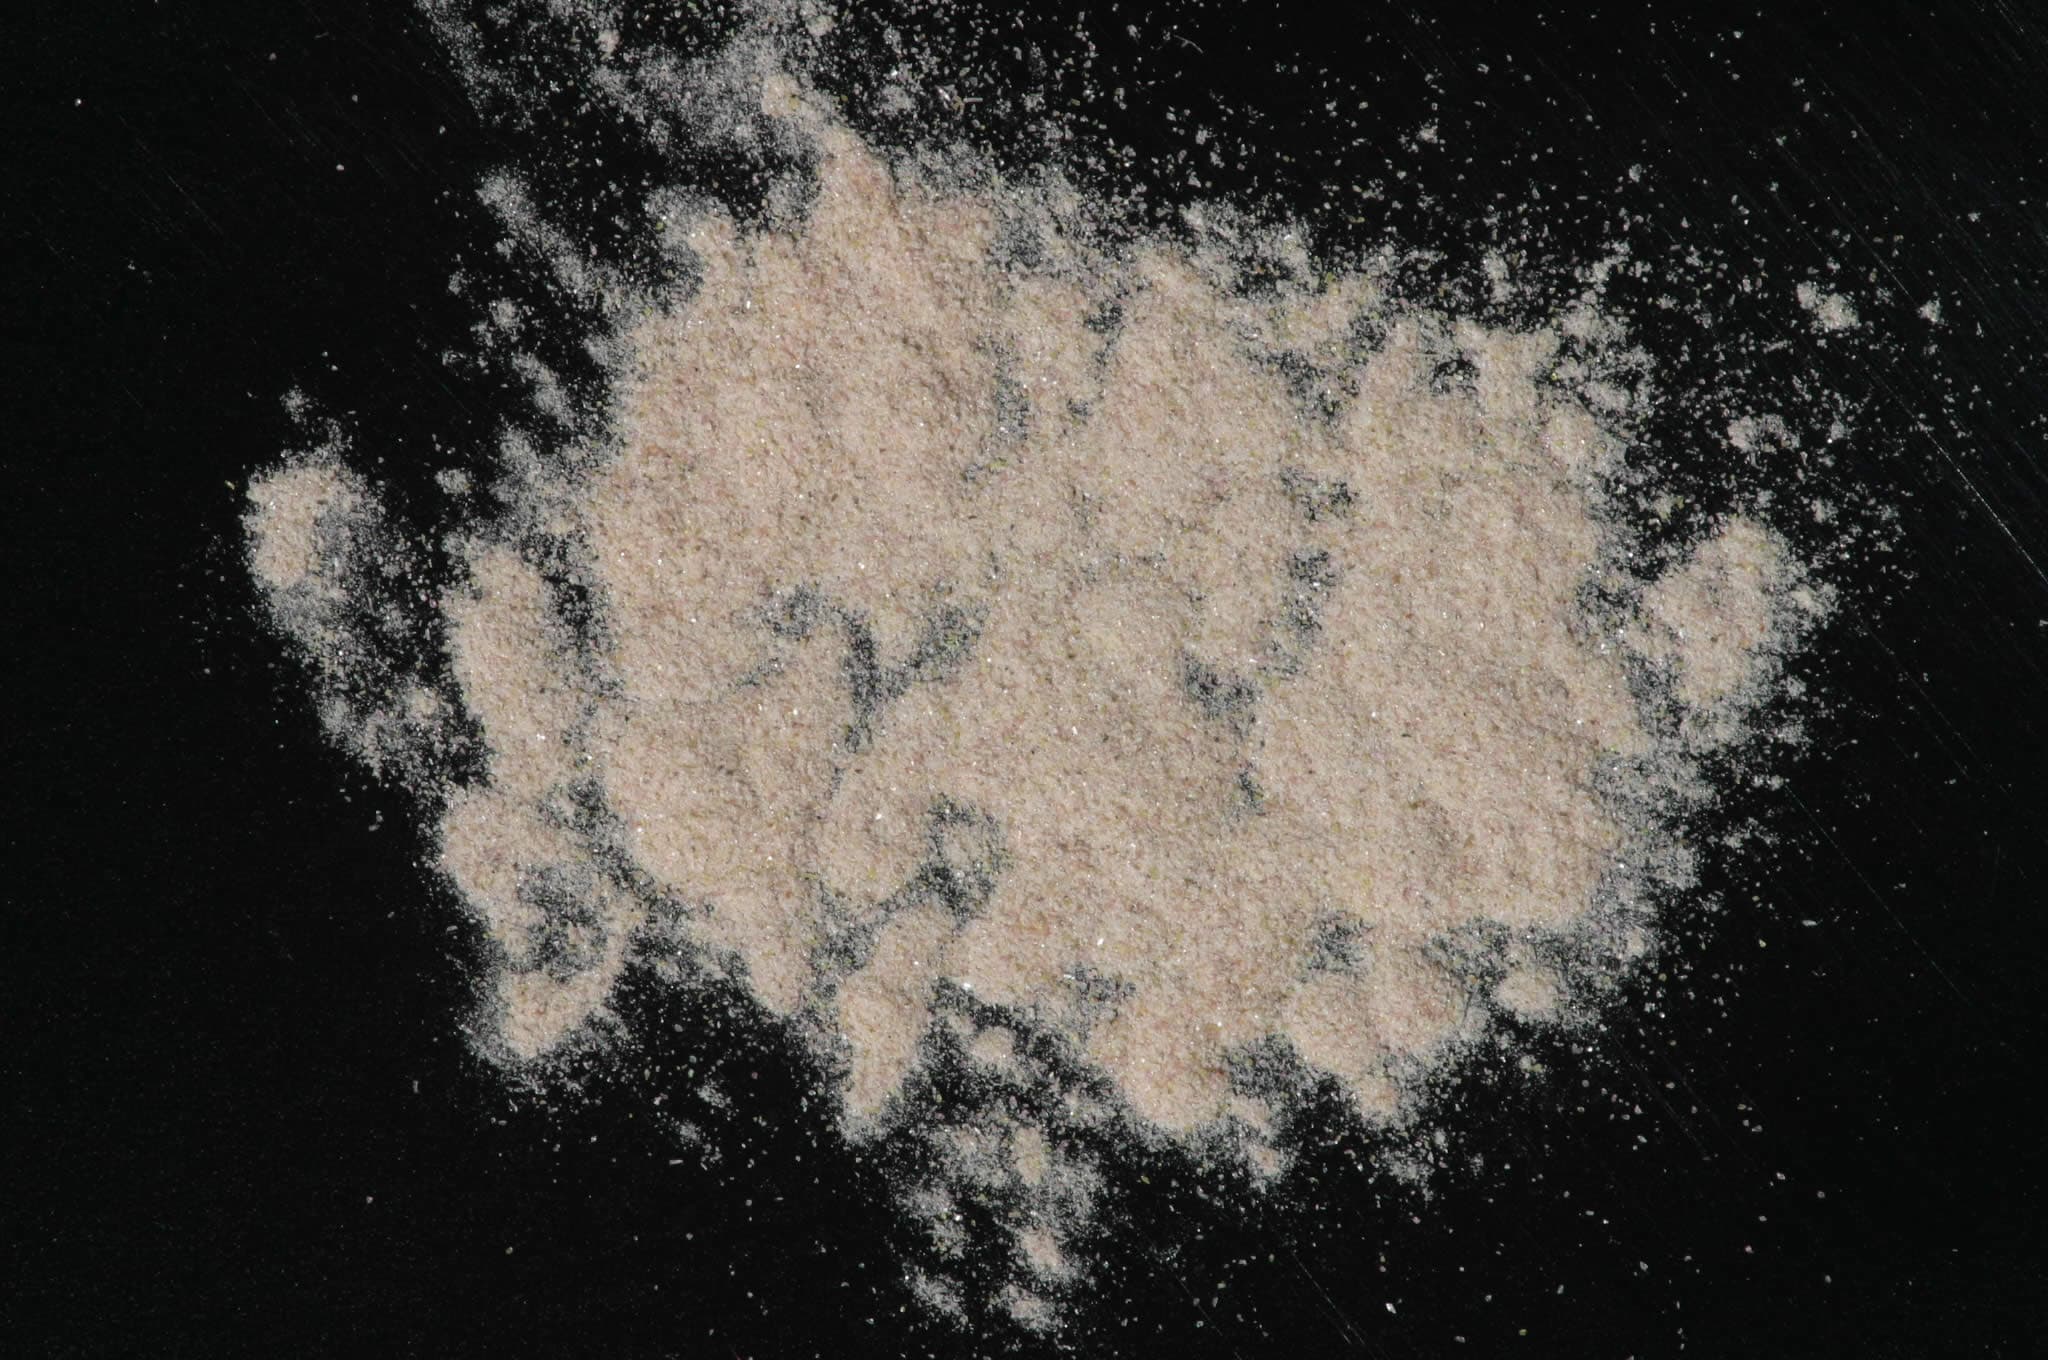
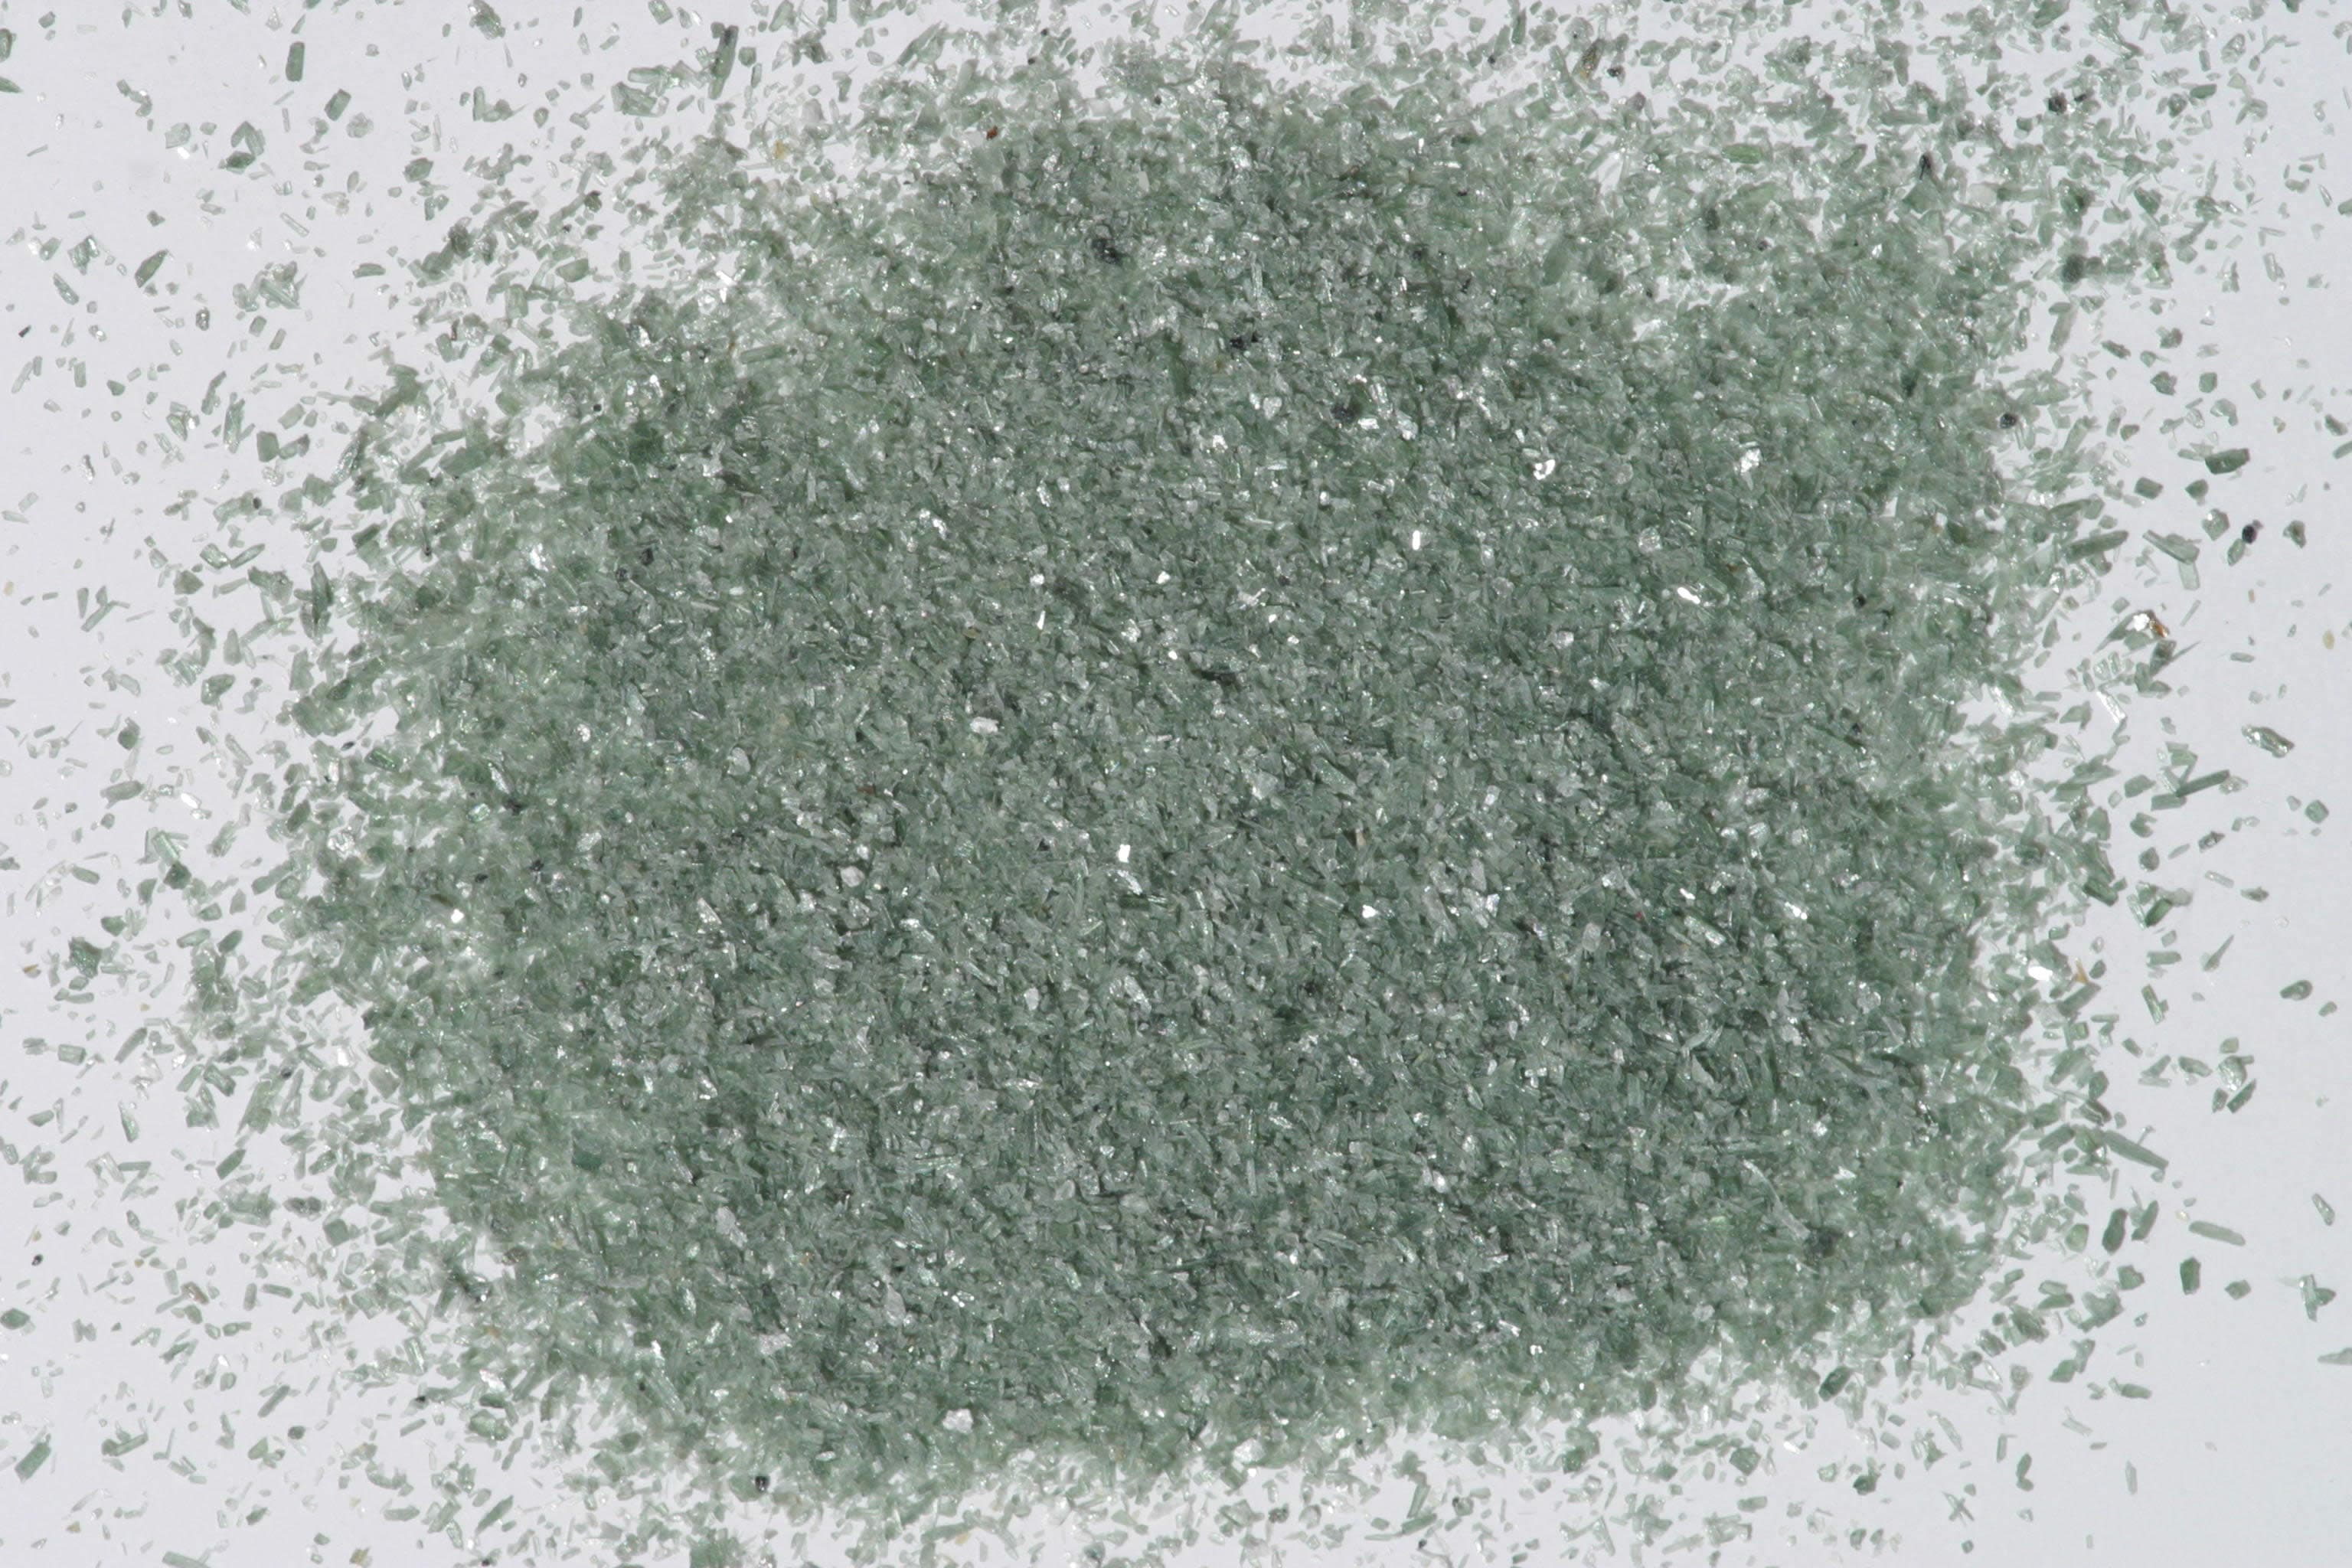
Sample photograph — USGS Spectral Library v7
Spectrum Details
- Modality
- FTIR
- Category
- soil
- Material Type
- Intimate
- Sample ID
- HS299.1B, HS299.2B, HS299.4B, HS299.6
- Collection Locality
- Mexico
- Spectral Purity
- 1b2_3_4_ # HS299.1B # 1= 0.2-3, 2= 1.5-6, 3= 6-25, 4= 20-150 microns SPECTRAL_PURITY: 1b2b3c4_ # HS299.2B # 1= 0.2-3, 2= 1.5-6, 3= 6-25, 4= 20-150 microns SPECTRAL_PURITY: 1b2_3_4_ # HS299.4B # 1= 0.2-3, 2= 1.5-6, 3= 6-25, 4= 20-150 microns SPECTRAL_PURITY: 1b2_3_4_ # HS299.6 # 1= 0.2-3, 2= 1.5-6, 3= 6-25, 4= 20-150 microns
- Composition / XRD
- None # XRF, EPMA, ICP(Trace), WChem
- Sample Description
- Clinozoisite is dimorphous with Zoisite. "This sample forms a continuous series with epidote. The sample contains some epidote and quartz impurities. The sample probably contains some Mn^3+ and Fe^3+ substituting for its aluminium, which would explain its reddish-brown color. The presence of these ions would also explain absorption features at 0.41, 0.46, 0.55, and 0.8 µm. Absorption features attributed to the hydroxyl and water appear at longer wavelengths than normal." Hunt, G.R., J.W. Salisbury, and C.J. Lenhoff, 1973, Visible and Near-Infrared Spectra of Minerals and Rocks: VI. Additional Silicates. Mod. Geol. 4, pp 85-106. IMAGE_OF_SAMPLE:
- XRD Analysis
- 40 kV - 30 mA, 7.0-9.5 keV File: clzst299_mdi, *.out (smear mount on quartz plate) References: Borg and Smith (1969); Huebner's reference patterns Found: monoclinic zoisite, subordinate quartz Sought but not found: zoisite Comment: Monoclinic zoisites have similar patterns. Grains are white (quartz), pink and yellow. Based on macroscopic color, eliminate epidote (green) and piemontite (red). Conclude HS-299 from a color-zoned clinozoisite crystal, but the origin of the colors is unknown. Reflections are very sharp, indicating excellent crystallinity.
- X Units
- cm⁻¹
- Y Units
- Absorbance
- Data Points
- 1,801
Download
Attribution
USGS Spectral Library Version 7, U.S. Geological Survey
License: Public Domain
DOI: 10.3133/ds1035Analyze in Workbench
Open this spectrum in the SpectralBench workbench for advanced analysis, peak detection, and comparison.
Open Workbench