Datolite — FTIR1,801 points · 400–4000 cm⁻¹
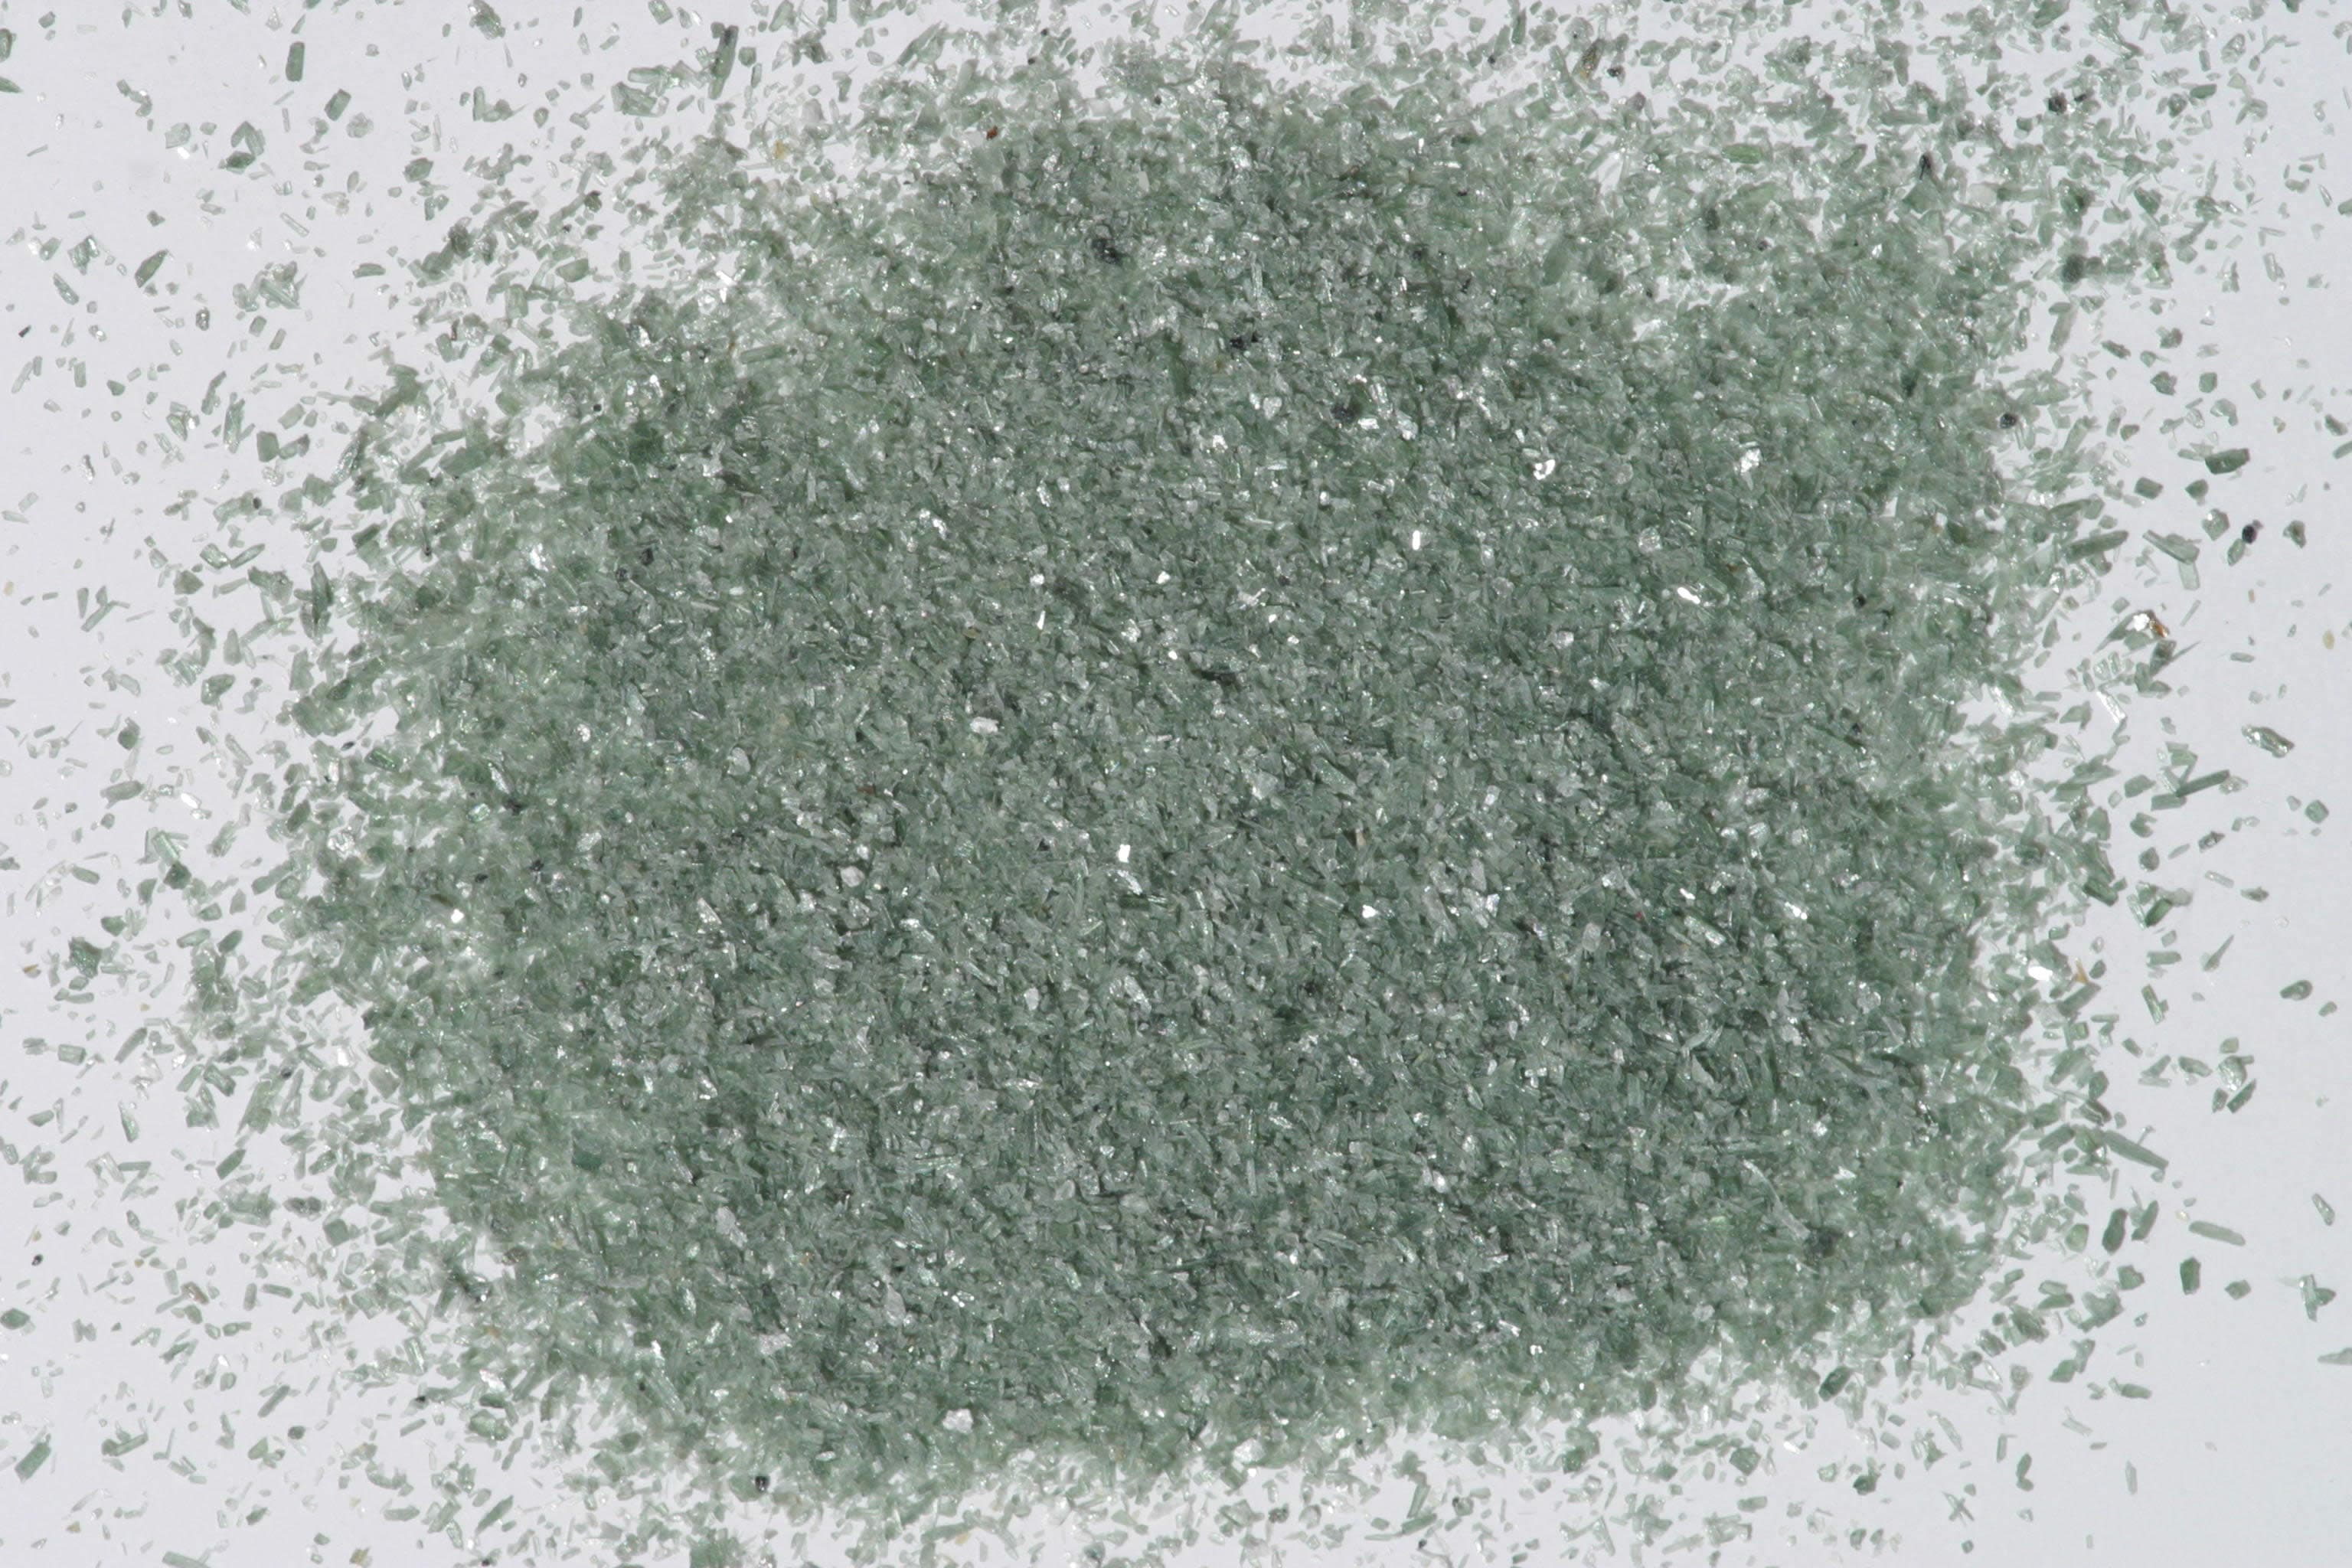
Sample photograph — USGS Spectral Library v7
Spectrum Details
- Modality
- FTIR
- Category
- mineral
- Material Type
- Nesosilicate
- Sample ID
- HS442.1B, HS442.2B, HS442.3B, HS442.4B
- Collection Locality
- Connecticut
- Spectral Purity
- 1b2_3_4_ # Datolite HS442.1B # 1= 0.2-3, 2= 1.5-6, 3= 6-25, 4= 20-150 microns SPECTRAL_PURITY: 1b2_3_4_ # Datolite HS442.2B # 1= 0.2-3, 2= 1.5-6, 3= 6-25, 4= 20-150 microns SPECTRAL_PURITY: 1b2b3b4b # Datolite HS442.3B # 1= 0.2-3, 2= 1.5-6, 3= 6-25, 4= 20-150 microns SPECTRAL_PURITY: 1b2_3_4_ # Datolite HS442.4B # 1= 0.2-3, 2= 1.5-6, 3= 6-25, 4= 20-150 microns
- Composition / XRD
- None # XRF, EPMA, ICP(Trace), WChem
- Sample Description
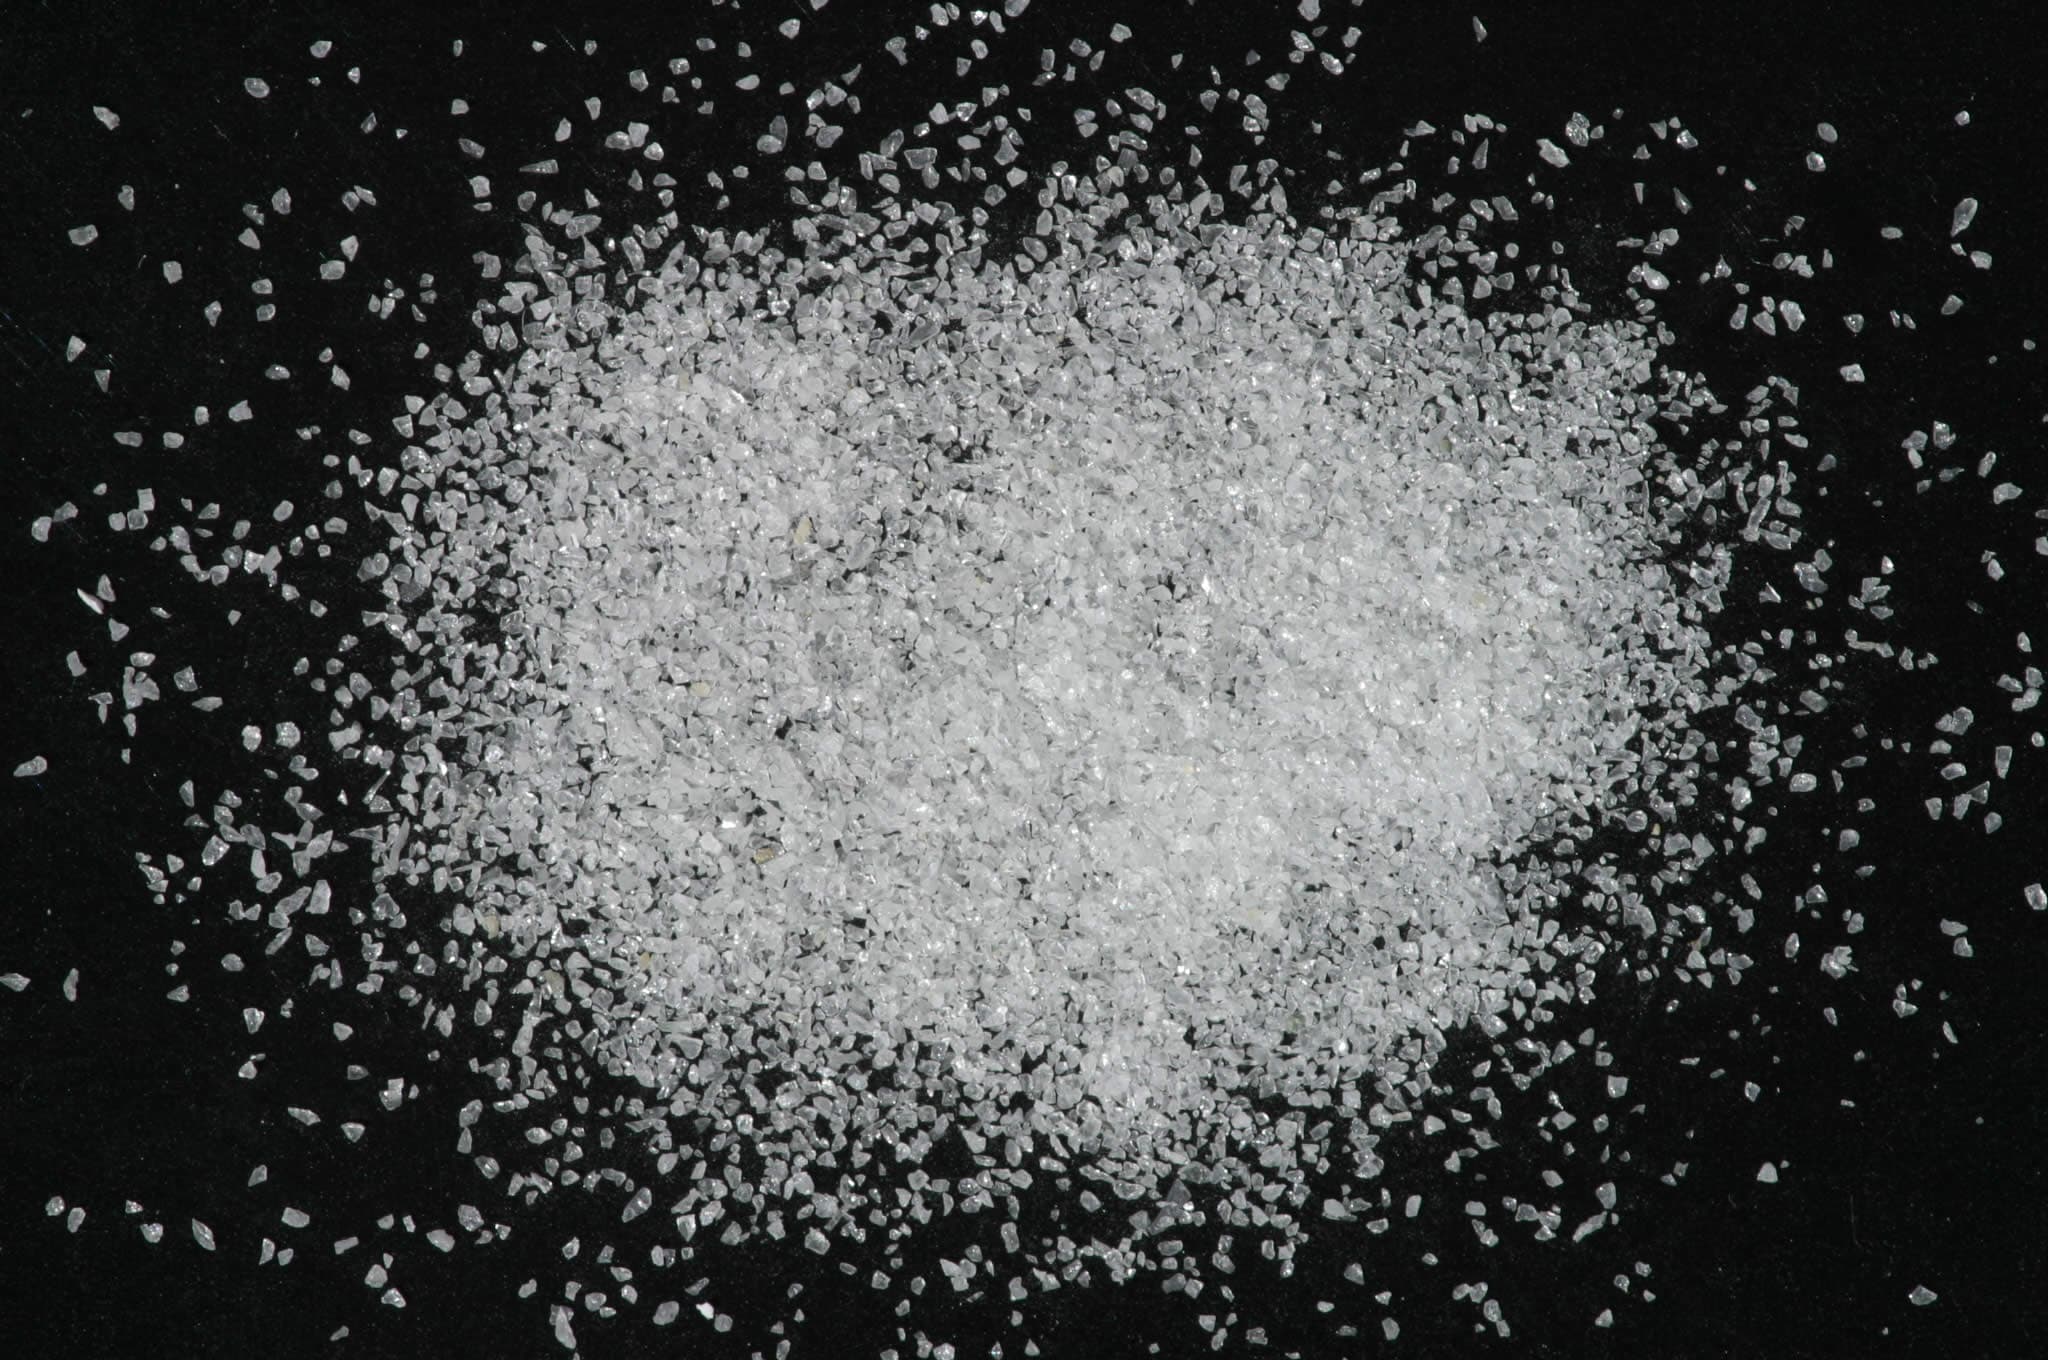
- "N-15 Datolite 442B--Conn. CaB(SiO4)(OH): Datolite is typical of a mineral of secondary origin found in cavities in basaltic lavas and similar rocks. Its spectrum is completely dominated by well-resolved features near 1.02 µ , 1.26 µ, 1.48 µ, 1.74 µ, and 1.80 µ as well as multiple bands between 2.1 and 2.5 µ. The overall appearance of this spectrum from 0.6 to 1.85 µ is essentially identical with that of gypsum (see Part IV, p. 7-8, spectra SS 11-A through D) including the unusual 1.7 µ feature, although all the features in datolite are shifted slightly to longer wavelengths from the corresponding positions in gypsum. However, in datolite the intense 1.9 µ feature, indicative of the presence of molecular water is completely absent, and yet the spectrum of gypsum is explained entirely in terms of its molecular water of crystallization, with the 1.7 µ feature involving librational modes of water. It would seem therefore, in the absence of water that the bands short of 1.85 µ in datolite must be due to combination modes of at least two different types of OH stretching vibrations. The bands between 2.1 and 2.5 µ can be explained in terms of combination of these OH stretching modes with lattice modes with additional contributions from carbonate vibrations (due to calcite, which is present as an impurity) and possibly from combinations involving the boron-oxygen stretching modes (see Part V, p. 130-131, spectra B-1 through B-4)." Hunt, G.R., J.W. Salisbury, and C.J. Lenhoff, 1973, Visible and near-infrared spectra of minerals and rocks: VI. Additional silicates. Modern Geology, v. 4, p. 85-106. Grain size fractions are indicated by the extension after the sample number: .1B = IMAGE_OF_SAMPLE:
- XRD Analysis
- Pure datolite (Norma Vergo).
- X Units
- cm⁻¹
- Y Units
- Absorbance
- Data Points
- 1,801
Download
Attribution
USGS Spectral Library Version 7, U.S. Geological Survey
License: Public Domain
DOI: 10.3133/ds1035Analyze in Workbench
Open this spectrum in the SpectralBench workbench for advanced analysis, peak detection, and comparison.
Open Workbench