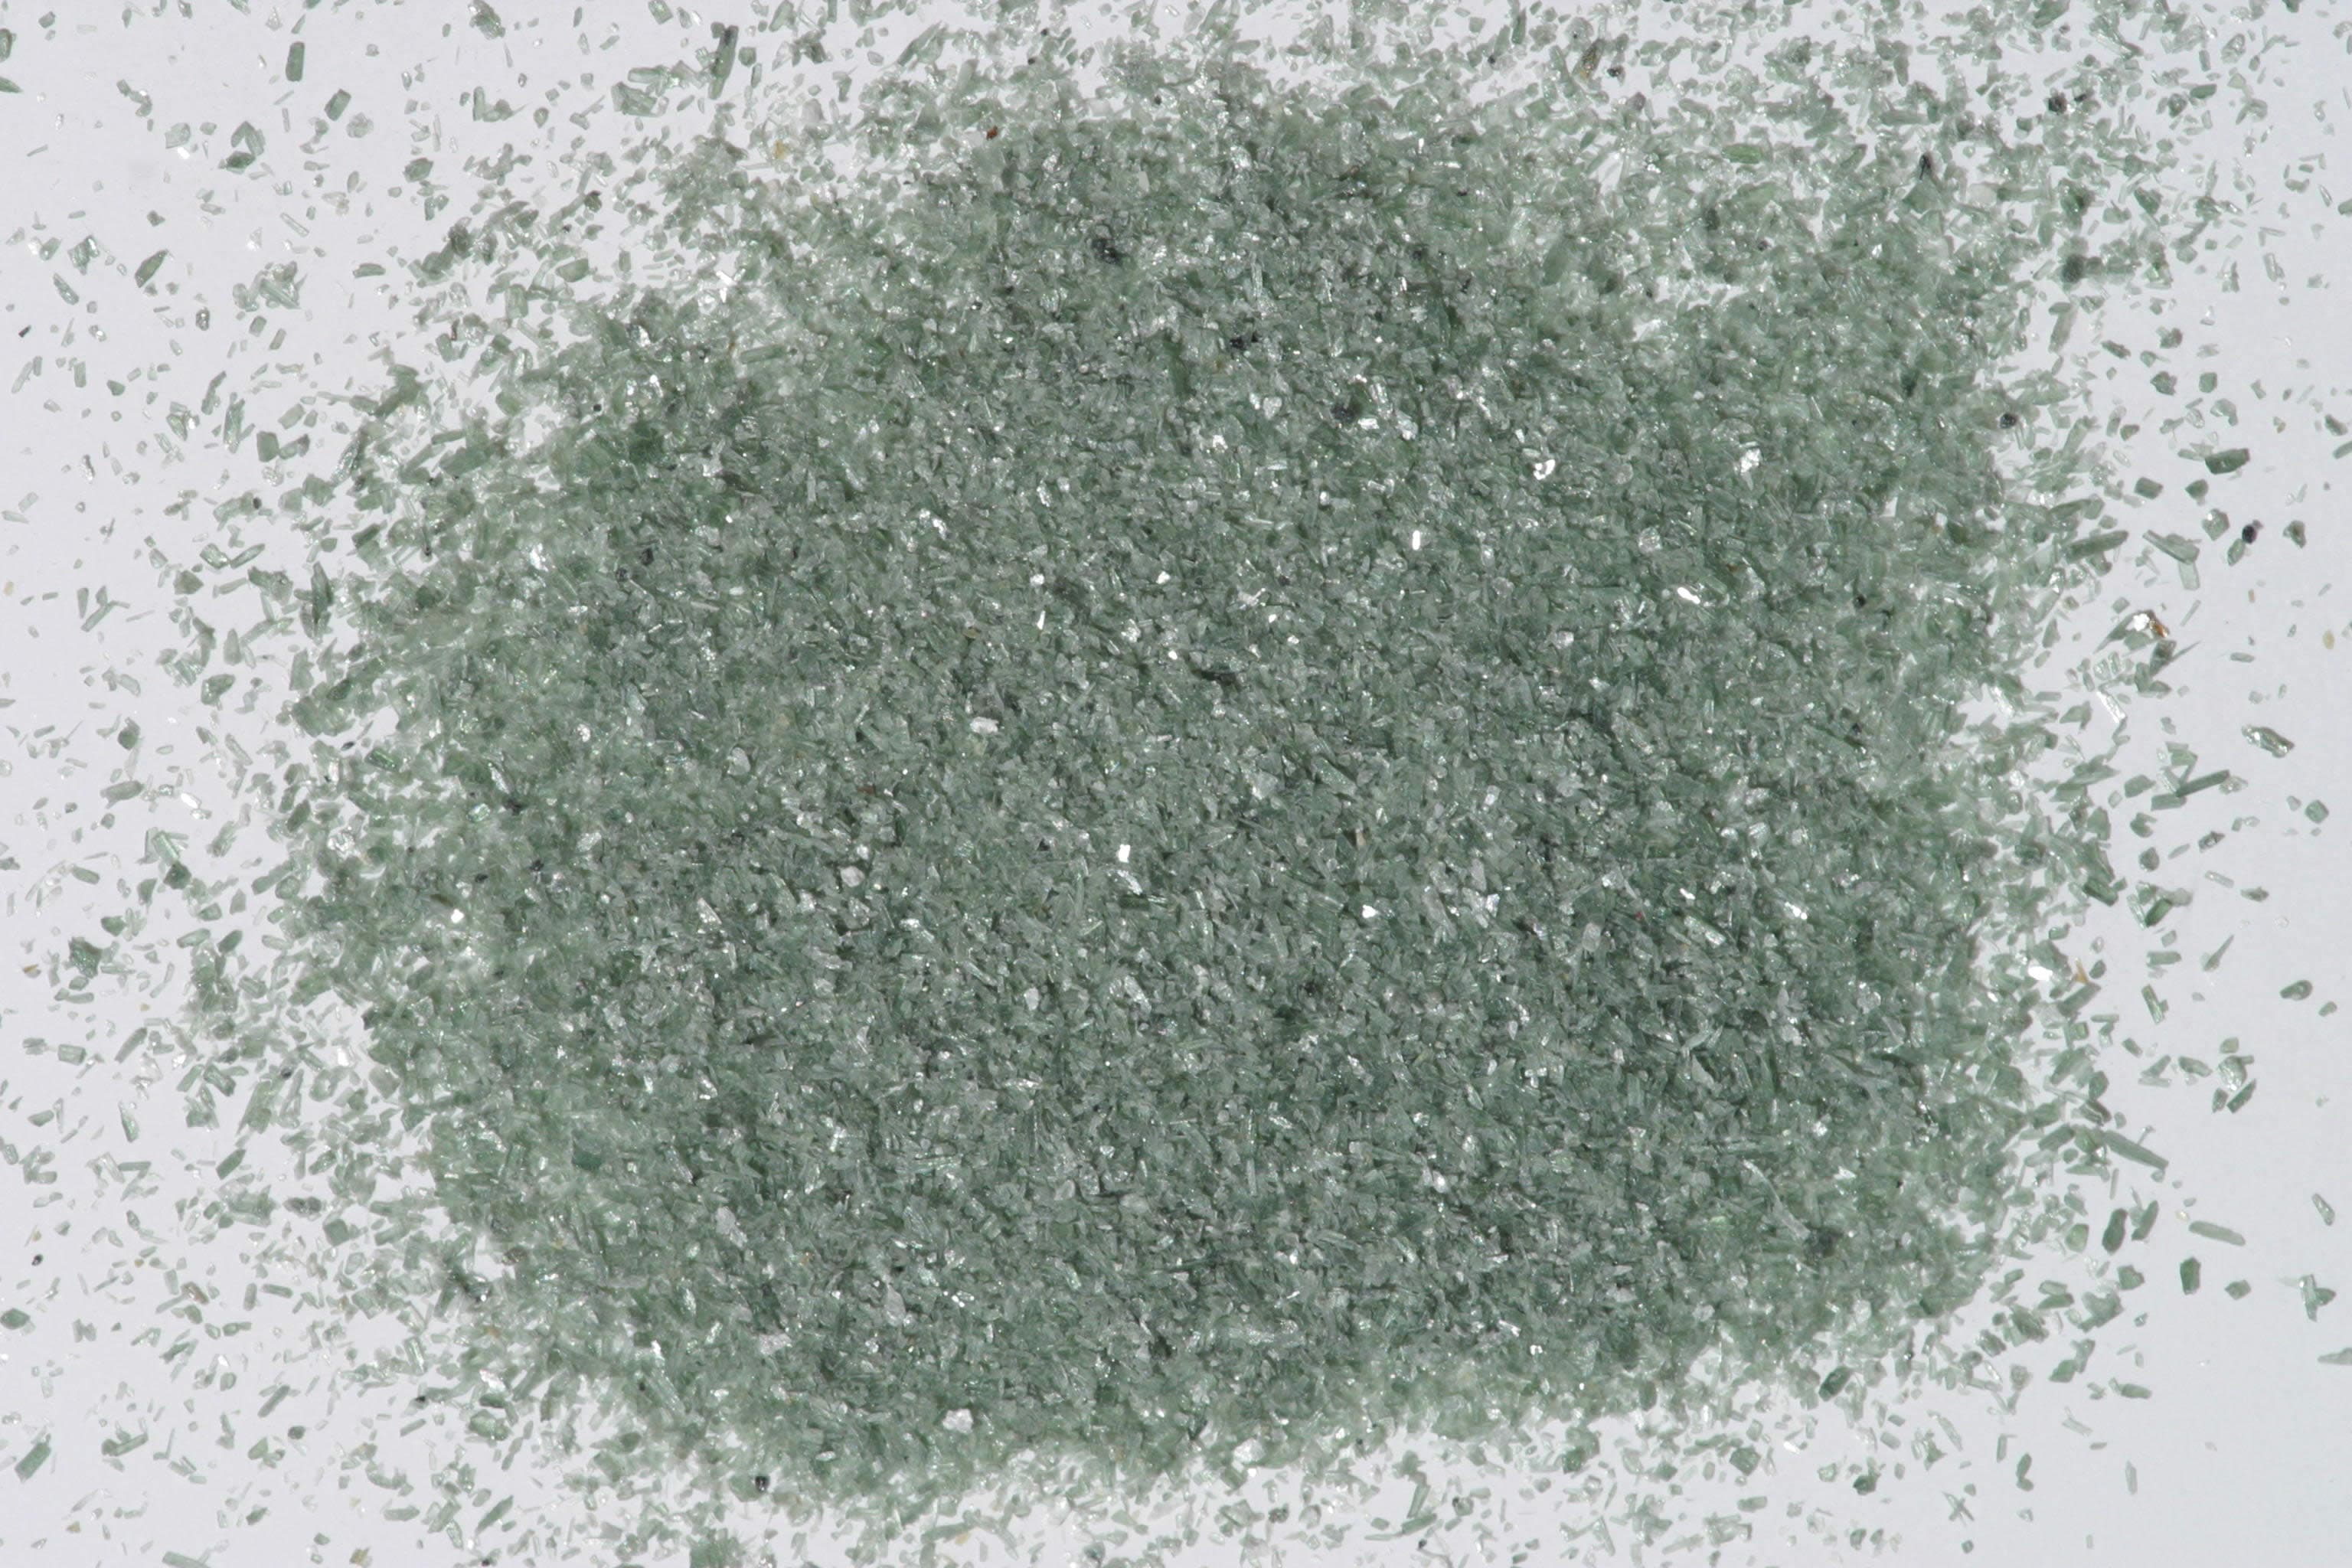
Hedenbergite — FTIR1,801 points · 400–4000 cm⁻¹
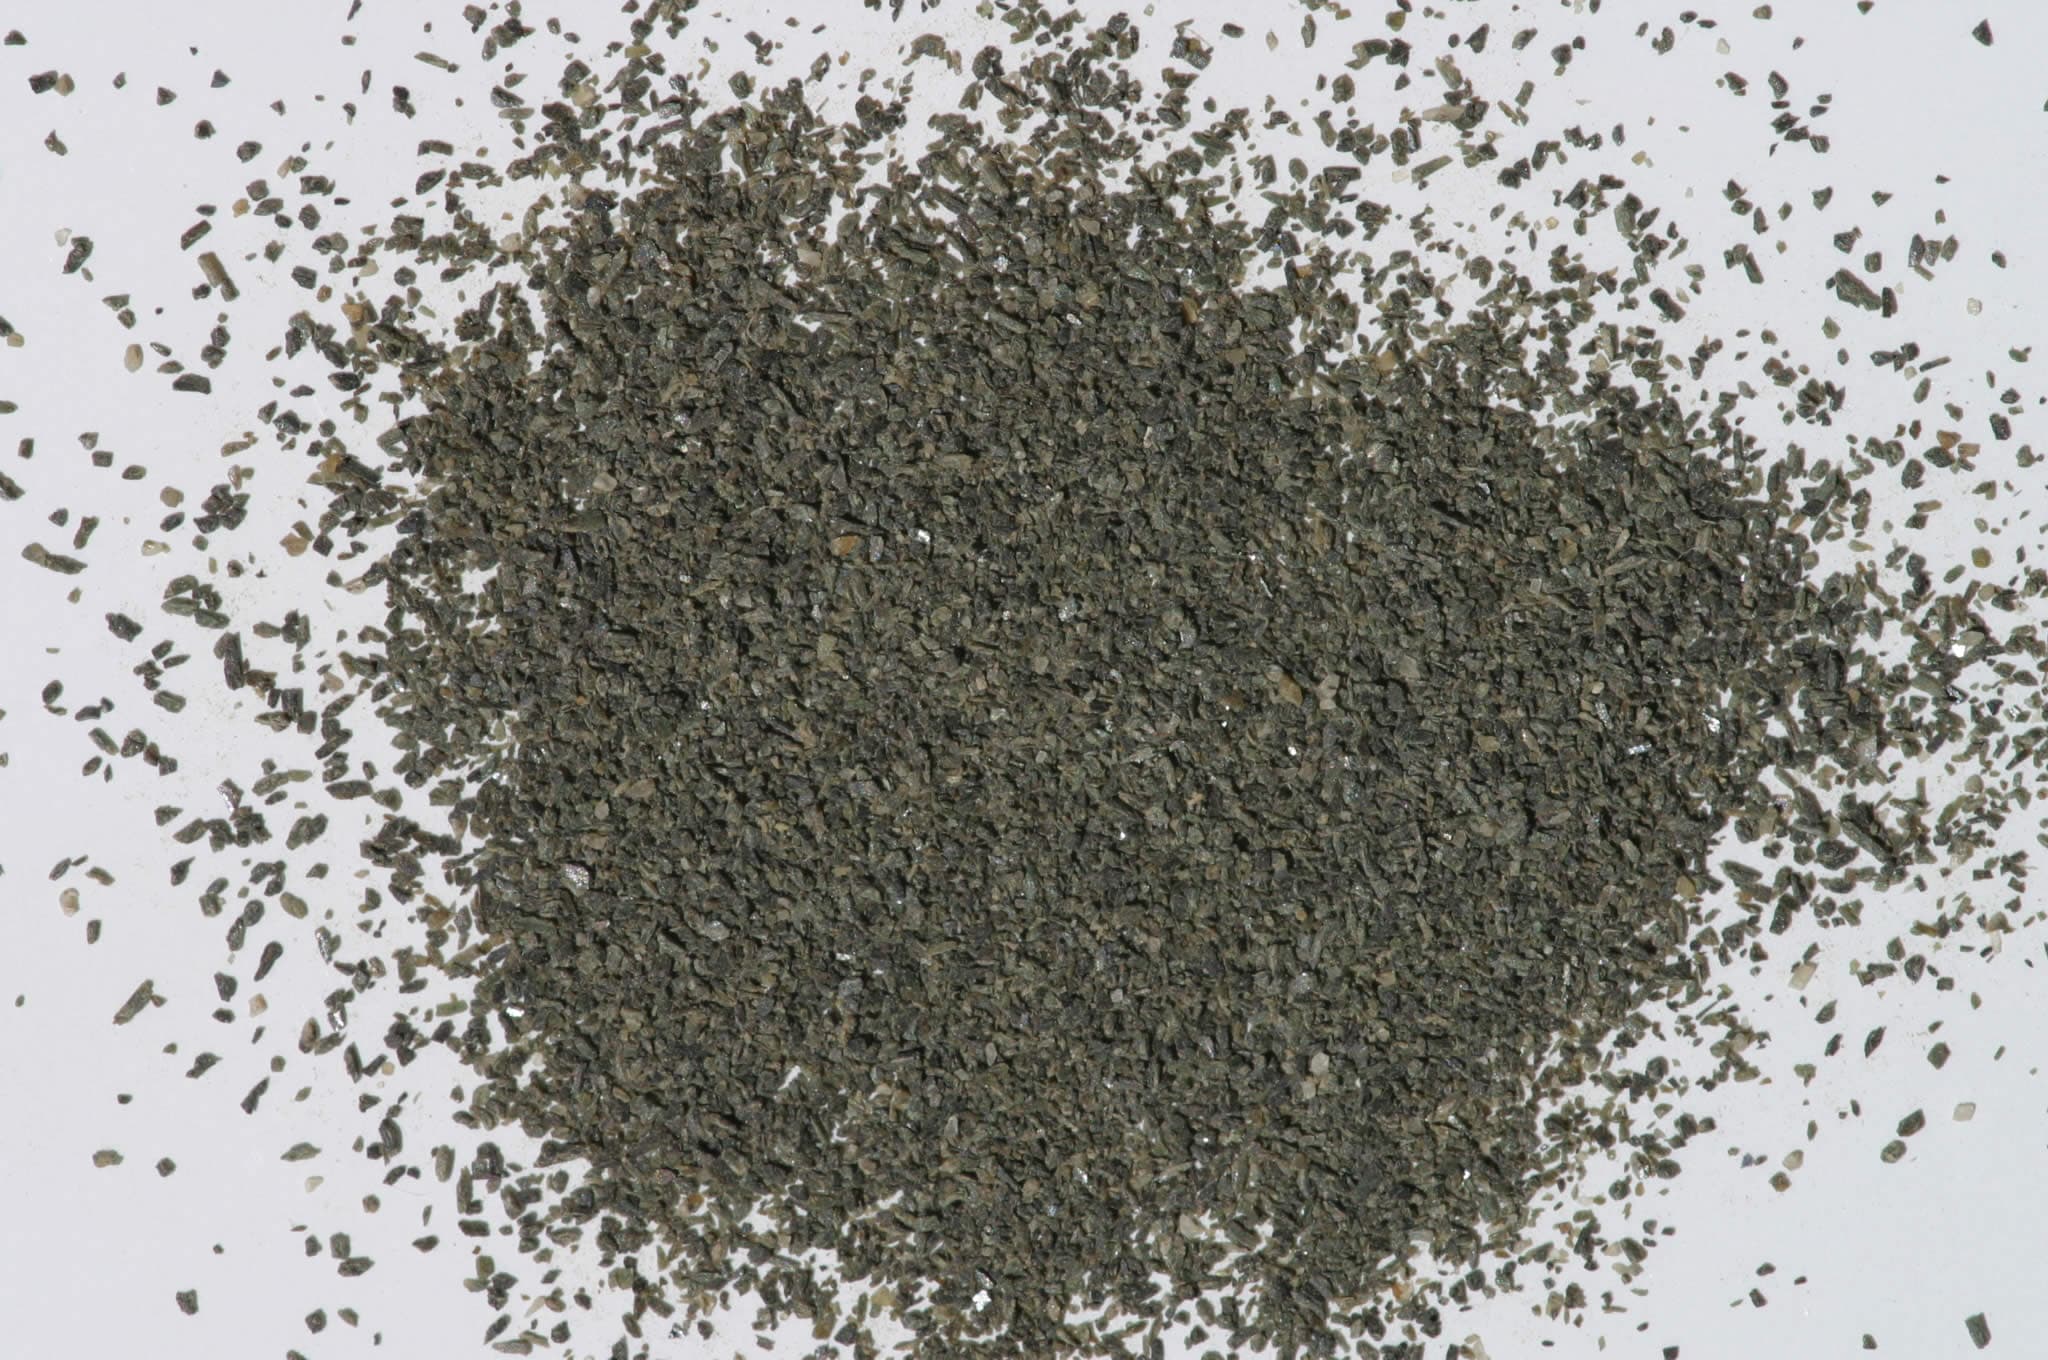
Sample photograph — USGS Spectral Library v7
Spectrum Details
- Modality
- FTIR
- Category
- mineral
- Material Type
- Inosilicate
- Sample ID
- HS10.1B, HS10.2B, HS10.3B, HS10.4B
- Collection Locality
- Silver Star, Montana
- Spectral Purity
- 1c2_3_4_ # Hedenbergite HS10.1B # 1= 0.2-3, 2= 1.5-6, 3= 6-25, 4= 20-150 microns SPECTRAL_PURITY: 1c2_3_4_ # Hedenbergite HS10.2B # 1= 0.2-3, 2= 1.5-6, 3= 6-25, 4= 20-150 microns SPECTRAL_PURITY: 1c2c3c4c # Hedenbergite HS10.3B # 1= 0.2-3, 2= 1.5-6, 3= 6-25, 4= 20-150 microns SPECTRAL_PURITY: 1c2_3_4_ # Hedenbergite HS10.4B # 1= 0.2-3, 2= 1.5-6, 3= 6-25, 4= 20-150 microns
- Composition / XRD
- None # XRF, EPMA, ICP(Trace), WChem
- Sample Description
- Forms series with Diopside and with Johannsenite. "S-17C. Pyroxene, variety Hedenbergite. Silver Star, Montana (10B). This sample has such strong ferric and ferrous ion bands on either side of 1µ that the reflectivity of the sample is reduced throughout the first half of the near-infrared range. Very weak water bands near 1.9 and 2.3 µ indicate the presence of some fluid inclusions. By contrast, a sample of artificially prepared hedenbergite displays a single strong ferrous ion band near 1.1 µ." Hunt, G.R., J.W. Salisbury, 1970, Visible and near-infrared spectra of minerals and rocks: I. Silicate minerals. Modern Geology, v. 1, p. 283-300. Grain size fractions are indicated by the extension after the sample number: .1B = IMAGE_OF_SAMPLE:
- XRD Analysis
- 40 kV - 30 mA, 7.3-9.5 keV File: hedbg10.mdi, *.out (smear mount on quartz plate) References: JSPDS#41-1372; Huebner's reference patterns Found: Clinopyroxene consistent with hedenbergite, minor quartz, unindexed weak to very weak reflections at 8.6, 3.16, 3.11 Angstroms Comment: Clinopyroxene pattern that is distinct from that of diopside (such as HS-15.3B). Pyroxene reflections are not sharp, suggesting poor crystallinity or compositional heterogeneity. Quartz identification originally based on four weak reflections, subsequently confirmed by optics (n=1.545). Optically, many grains are discolored by brown, heterogeneously distributed material; the actual pyroxene grains are colorless by comparison. Does the optical spectrum see the pyroxene?
- X Units
- cm⁻¹
- Y Units
- Absorbance
- Data Points
- 1,801
Download
Attribution
USGS Spectral Library Version 7, U.S. Geological Survey
License: Public Domain
DOI: 10.3133/ds1035Analyze in Workbench
Open this spectrum in the SpectralBench workbench for advanced analysis, peak detection, and comparison.
Open Workbench