Hypersthene — FTIR1,801 points · 400–4000 cm⁻¹
Spectrum Details
- Modality
- FTIR
- Category
- mineral
- Material Type
- Inosilicate
- Sample ID
- PYX02.a, PYX02.b, PYX02.c, PYX02.d, PYX02.e, PYX02.f, PYX02.g, PYX02.h
- Collection Locality
- Bamble, Norway
- Spectral Purity
- 1c2c3b4b # Hypersthene PYX02.a # 1= 0.2-3, 2= 1.5-6, 3= 6-25, 4= 20-150 microns SPECTRAL_PURITY: 1c2c3b4b # Hypersthene PYX02.b # 1= 0.2-3, 2= 1.5-6, 3= 6-25, 4= 20-150 microns SPECTRAL_PURITY: 1c2c3b4b # Hypersthene PYX02.c # 1= 0.2-3, 2= 1.5-6, 3= 6-25, 4= 20-150 microns SPECTRAL_PURITY: 1c2c3b4b # Hypersthene PYX02.d # 1= 0.2-3, 2= 1.5-6, 3= 6-25, 4= 20-150 microns SPECTRAL_PURITY: 1c2c3b4b # Hypersthene PYX02.e # 1= 0.2-3, 2= 1.5-6, 3= 6-25, 4= 20-150 microns SPECTRAL_PURITY: 1c2c3b4b # Hypersthene PYX02.f # 1= 0.2-3, 2= 1.5-6, 3= 6-25, 4= 20-150 microns SPECTRAL_PURITY: 1c2c3b4b # Hypersthene PYX02.g # 1= 0.2-3, 2= 1.5-6, 3= 6-25, 4= 20-150 microns SPECTRAL_PURITY: 1c2c3b4b # Hypersthene PYX02.h # 1= 0.2-3, 2= 1.5-6, 3= 6-25, 4= 20-150 microns
- Composition / XRD
- XRF
- Sample Description
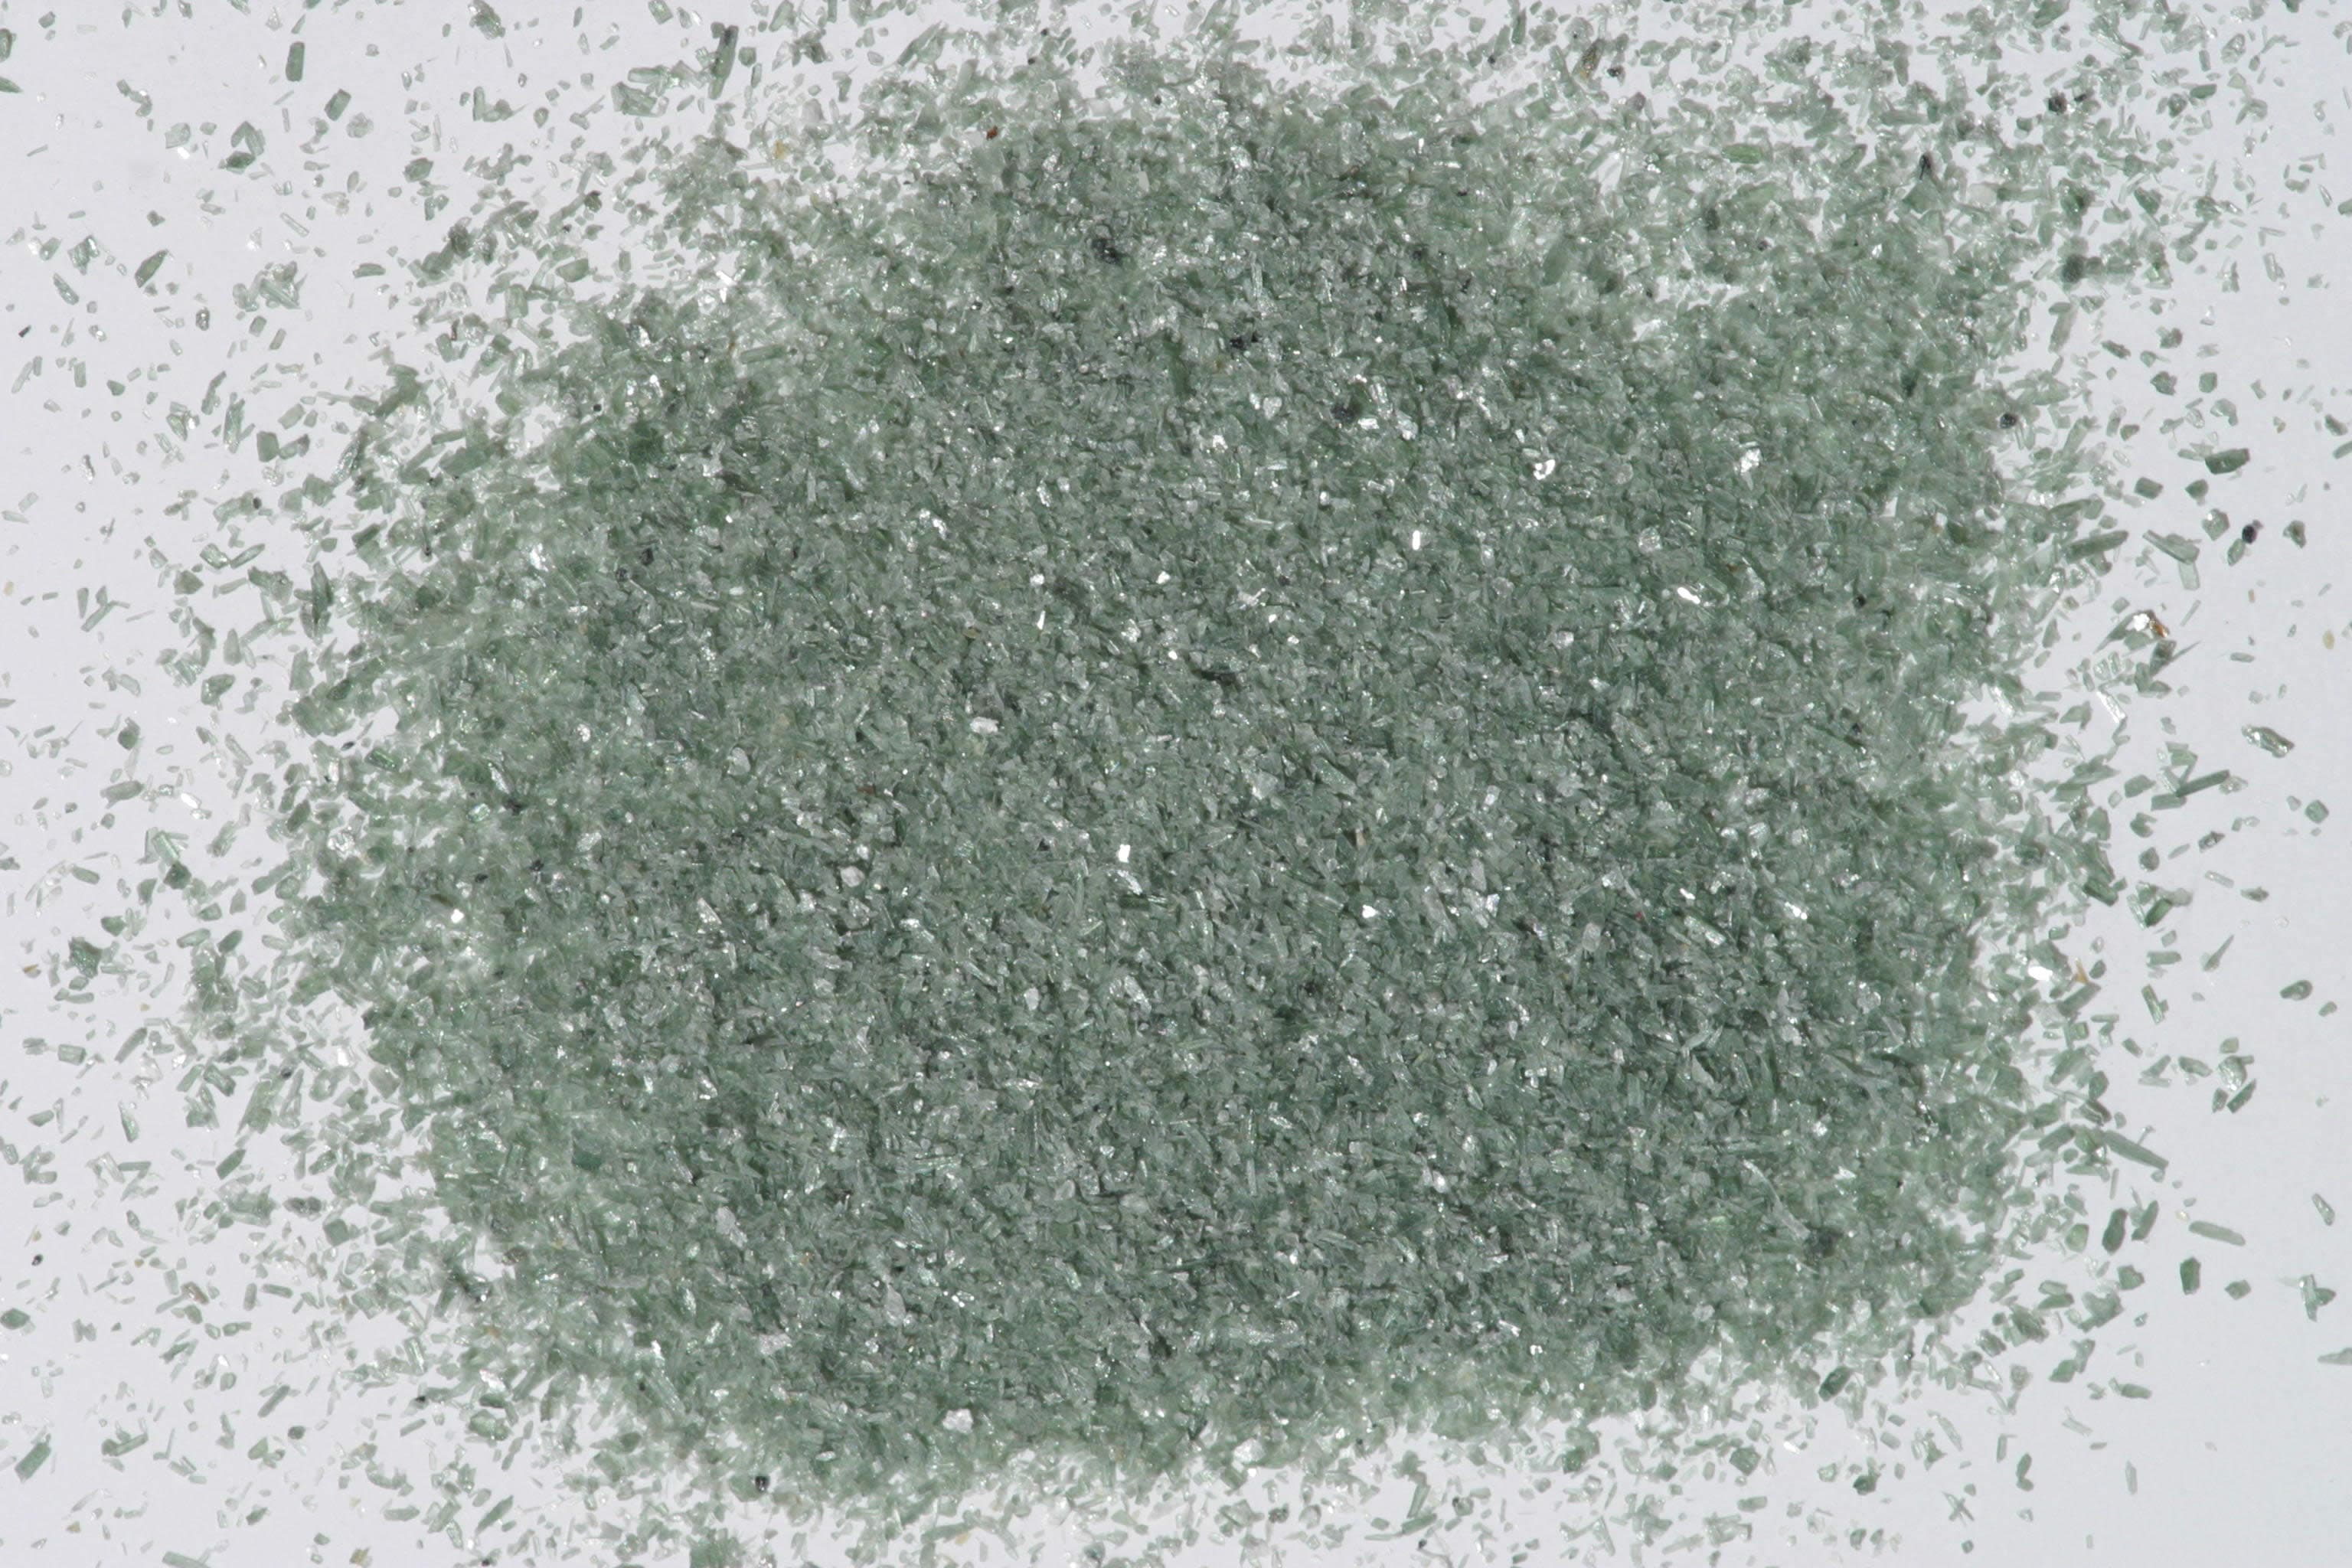
- Intermediate member of the series Enstatite-Orthoferrosilite. The original sample description and vis-nir spectrum was published by: Singer, R.B., 1981, Near-Infrared spectral reflectance of mineral mixtures: Systematic combinations of pyroxenes, olivine, and iron oxides: J. Geophys Res., v. 86, p. 7967-7982. The sample is pure pyroxene except for a small (less than 2%?) amount of amphibole (possibly tremolite). The amphibole absorption features appear in the spectra as weak, narrow bands at 2.3 m and 1.4 m. Singer suspected the tremolite contamination and the amphibole features are in the higher resolution spectra in this library support that. The sample was ground and wet sieved in methanol at the USGS Denver Spectroscopy Laboratory by Roger Clark. SEM photos were done by R. Clark on each sieve interval to characterize the grain sizes. Grain size fractions are indicated by the extension after the sample number: .g = 5-10 microns .a = 10-20 microns .d = 20-30 microns .e = 30-45 microns .f = 45-104 microns .b = 104-150 microns .c = 150-250 microns .h = >250 microns IMAGE_OF_SAMPLE: NO PHOTO
- X Units
- cm⁻¹
- Y Units
- Absorbance
- Data Points
- 1,801
Download
Attribution
USGS Spectral Library Version 7, U.S. Geological Survey
License: Public Domain
DOI: 10.3133/ds1035Analyze in Workbench
Open this spectrum in the SpectralBench workbench for advanced analysis, peak detection, and comparison.
Open Workbench