Lignin alkali SA-370959 — NIR2,126 points · 4000–12500 cm⁻¹
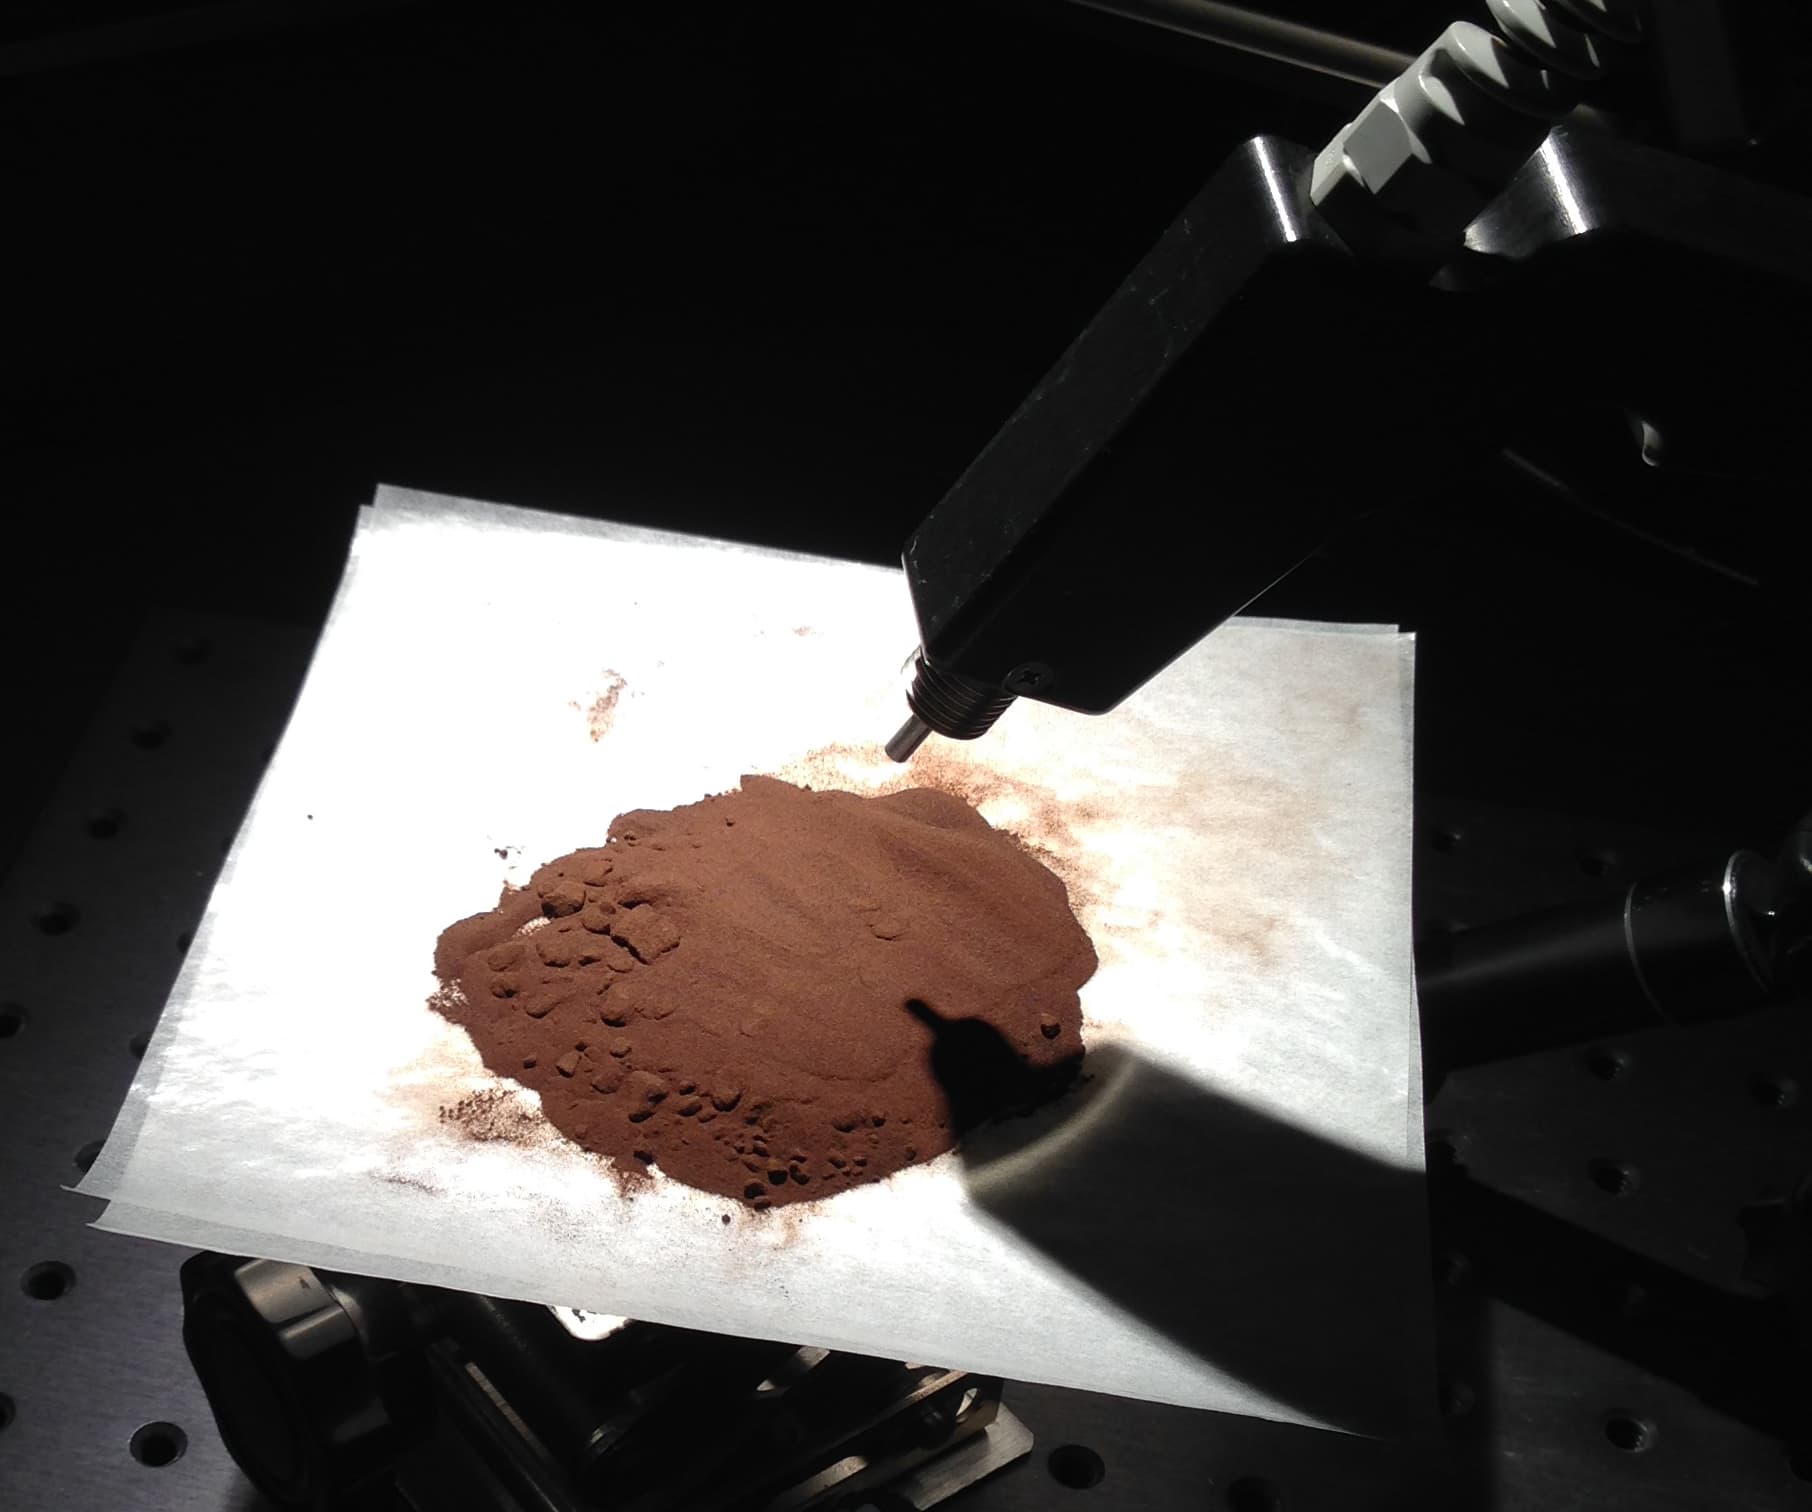
Sample photograph — USGS Spectral Library v7
Spectrum Details
- Modality
- NIR
- Category
- organic
- Material Type
- Phenol; Plant Phenolic; Polyphenol
- Sample ID
- Lignin, alkali SA-370959
- Collection Locality
- Purchased from Sigma Aldrich chemistry
- Spectral Purity
- 1a2a3_4_ # 1= 0.2-3, 2= 1.5-6, 3= 6-25, 4= 20-150 microns
- Composition / XRD
- Analysis done by Sigma Aldrich, The Certificate of Analysis can be found on the Sigma Aldrich Website using the Product and Lot Numbers.
- Sample Description
- Sample of brown powder. Other Names: alkali lignin; kraft lignin CAS #: 8068-05-1 Product #: 370959 Lot #: 08012BB Lignin is a complex, hydrophobic molecule of aromatic nature. Lignin is heterogeneous and lacks a defined primary structure. Lignin is mainly comprised of oxyphenylpropae units assembled in a large macromolecule polymer with molecular mass in excess of 10,000 unified atomic mass units (u). There are three monolignol monomers, methoxylated to various degrees: p-coumaryl alcohol, coniferyl alcohol, and sinapyl alcohol. These lignols are incorporated into lignin in the form of the phenylpropanoids p-hydroxyphenyl, guaiacyl, and syringyl, respectively. Lignin, along with cellulose, is responsible for the rigidity of plant cell walls. It is an integral part of the secondary cell walls of plants. Lignin fills the spaces in the cell wall between cellulose, hemicellulose, and pectin components, especially in xylem tracheids, vessel elements and sclereid cells. It is covalently linked to hemicellulose and crosslinks to different plant polysaccharides, conferring mechanical strength to the cell wall and by extension the plant as a whole. Lignin content in the leaves of plants ranges, on average by dry weight, from a low of 15% in cultivated grass species to a high of 24% in conifer needles by dry weight ; in the Accelerated Canopy Chemistry Program data set the overall range is from 11% to 33% (see Kokaly and others 2009). It ranges from 25% to 33% of the dry mass of wood. This spectrum was used in the following publication: Kokaly, R.F., Asner, G.P., Ollinger, S.V., and Martin, M.E., 2009, Characterizing canopy biochemistry from imaging spectroscopy and its application to ecosystem studies, Remote Sensing of Environment, Volume 113, Pages S78-S91. http://dx.doi.org/10.1016/j.rse.2008.10.018 IMAGE_OF_SAMPLE:
- X Units
- cm⁻¹
- Y Units
- Absorbance
- Data Points
- 2,126
Download
Attribution
USGS Spectral Library Version 7, U.S. Geological Survey
License: Public Domain
DOI: 10.3133/ds1035Analyze in Workbench
Open this spectrum in the SpectralBench workbench for advanced analysis, peak detection, and comparison.
Open Workbench