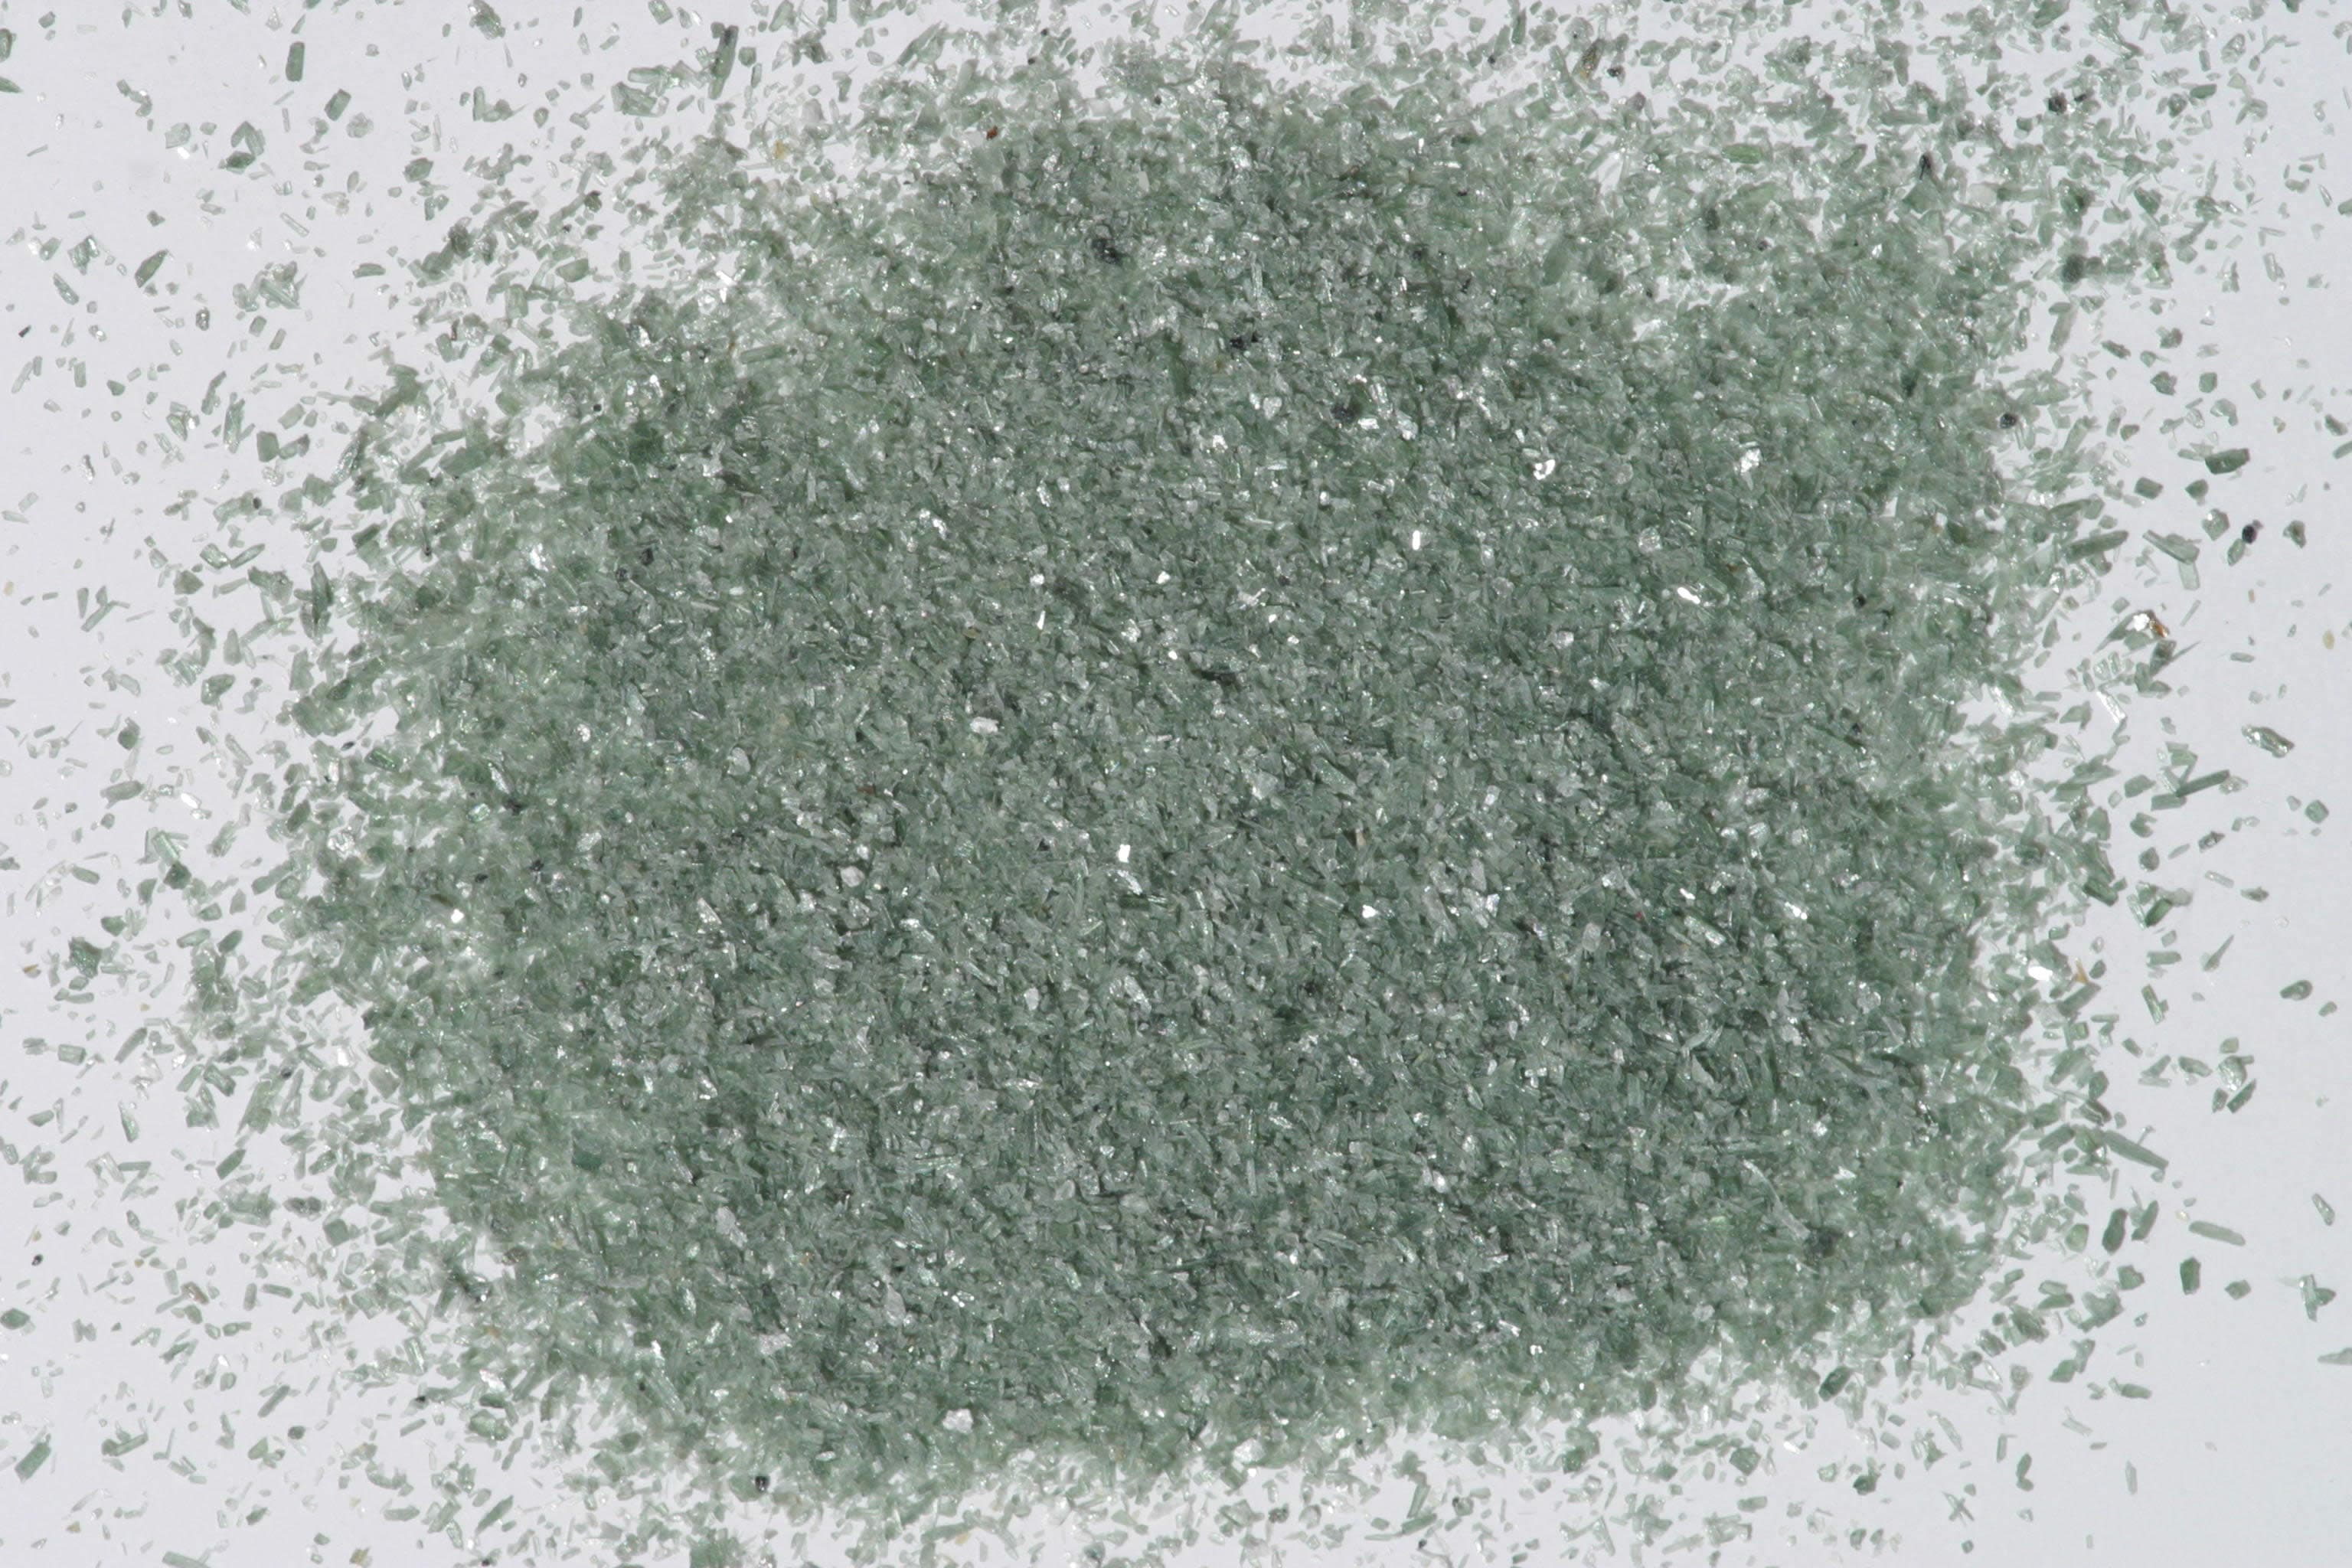
Malachite — FTIR1,801 points · 400–4000 cm⁻¹
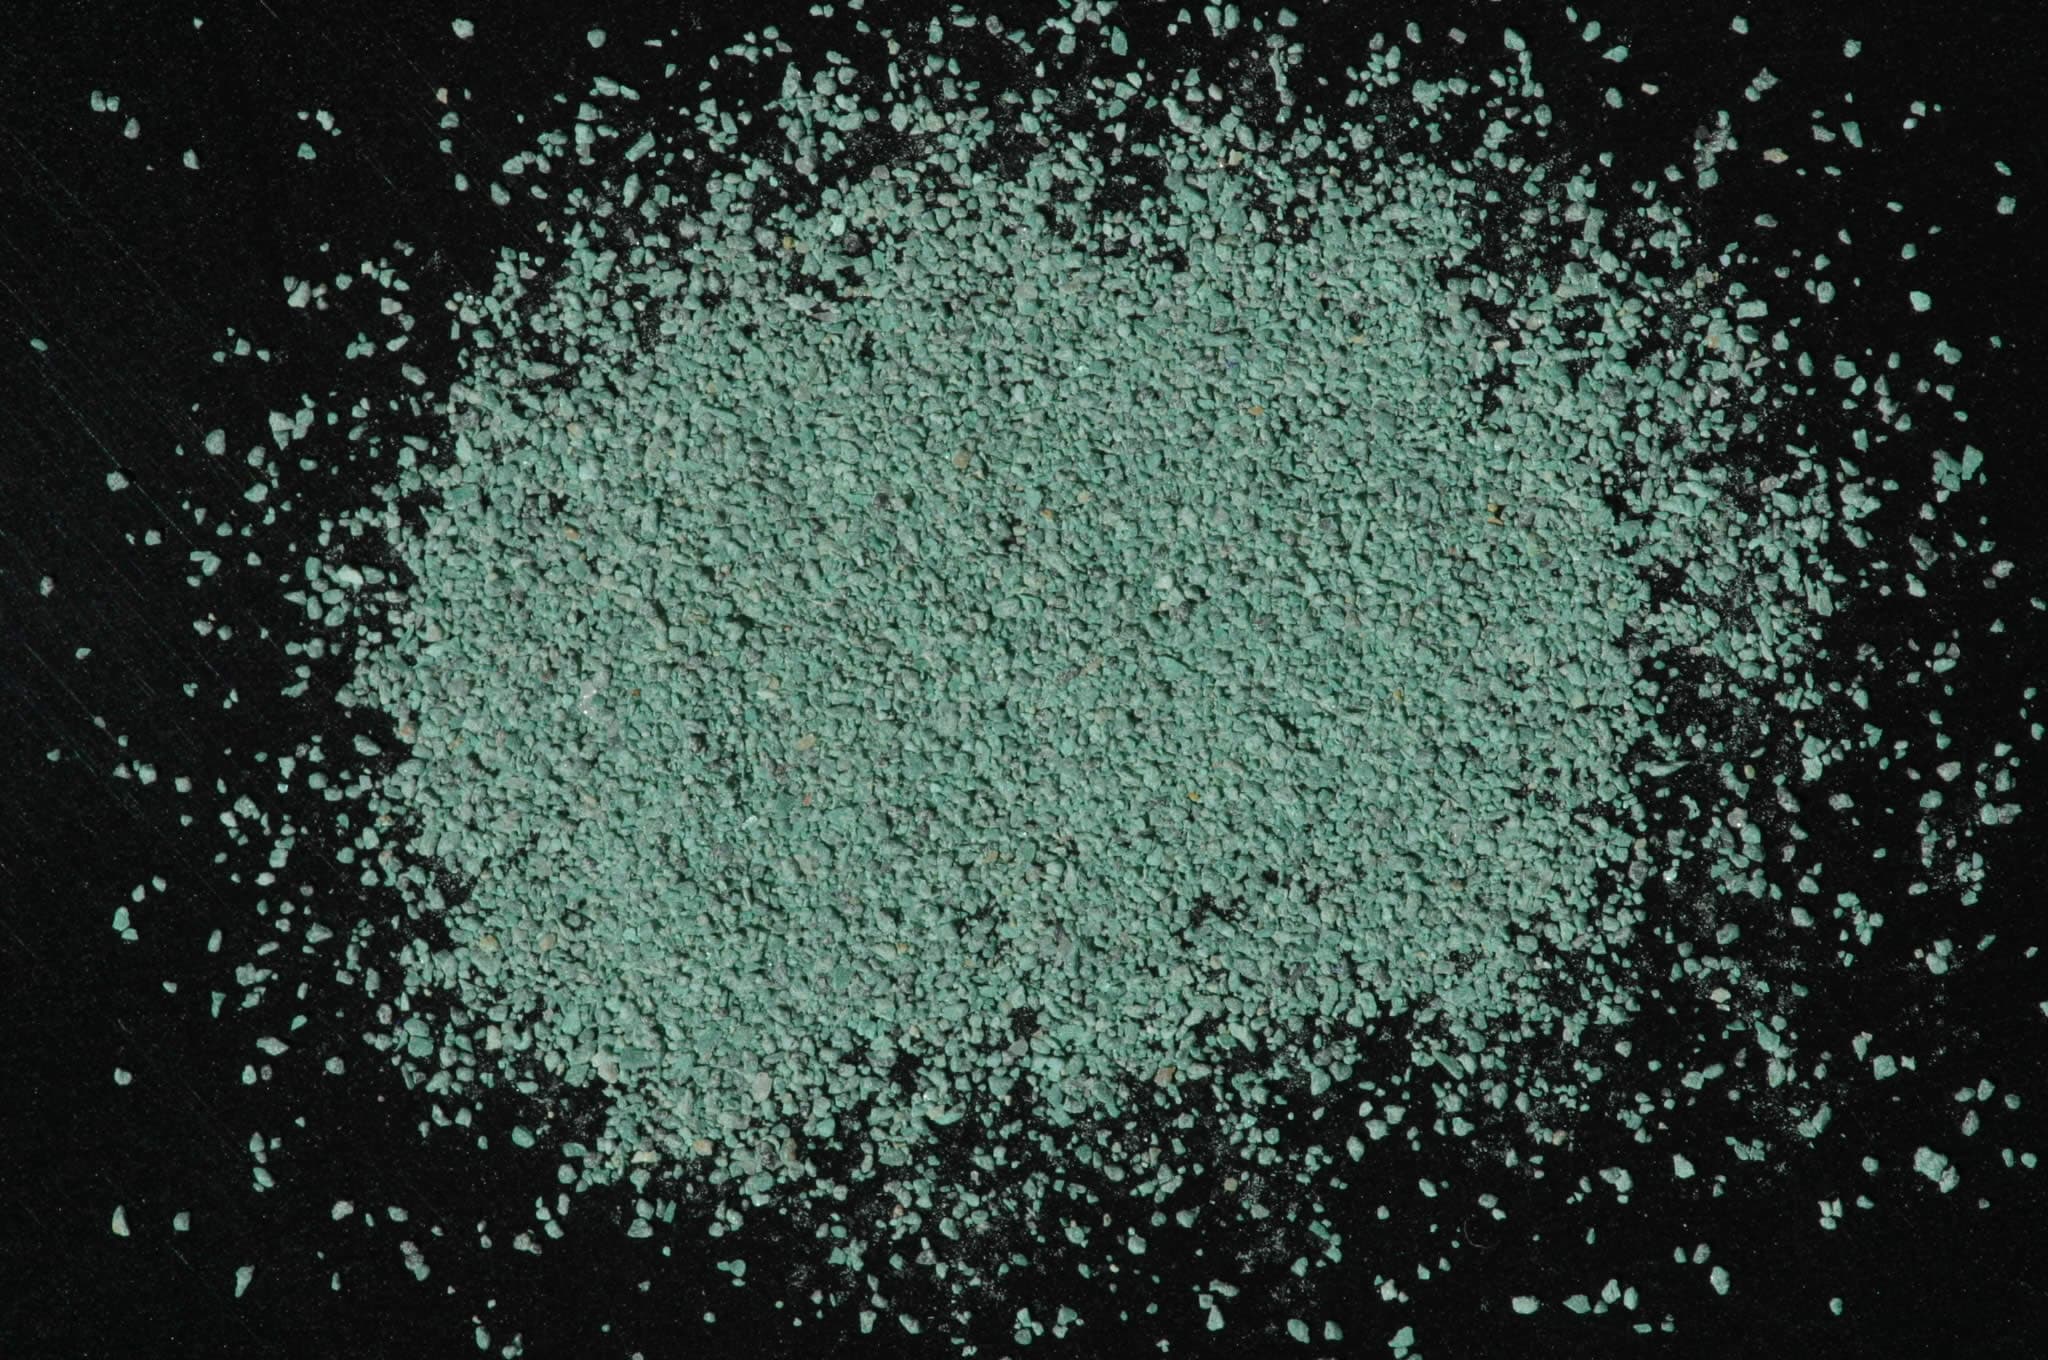
Sample photograph — USGS Spectral Library v7
Spectrum Details
- Modality
- FTIR
- Category
- mineral
- Material Type
- Carbonate
- Sample ID
- HS254.1B, HS254.2B, HS254.3B, HS254.4B
- Collection Locality
- Bisbee, Arizona
- Spectral Purity
- 1b2_3_4_ # HS254.1B # 1= 0.2-3, 2= 1.5-6, 3= 6-25, 4= 20-150 microns SPECTRAL_PURITY: 1b2_3_4_ # HS254.2B # 1= 0.2-3, 2= 1.5-6, 3= 6-25, 4= 20-150 microns SPECTRAL_PURITY: 1b2b3b4_ # HS254.3B # 1= 0.2-3, 2= 1.5-6, 3= 6-25, 4= 20-150 microns SPECTRAL_PURITY: 1b2_3_4_ # HS254.4B # 1= 0.2-3, 2= 1.5-6, 3= 6-25, 4= 20-150 microns
- Composition / XRD
- None # XRF, EPMA, ICP(Trace), WChem COMPOSITION_TRACE:
- Sample Description
- Original spectrum published in: Hunt, G.R., J.W. Salisbury, 1971, Visible and near-infrared spectra of minerals and rocks: II. Carbonates. Modern Geology, v. 2, p. 23-30. With the following notes: "Malachite, CuCO3•Cu(OH)2, like azurite is a basic carbonate of copper. More common than azurite, it is still only a minor ore of copper, occurring as a secondary mineral in the upper oxidized zone of copper deposits. This particular sample appears to be relatively pure." "Like azurite, malachite presents an atypical carbonate ion spectrum. Apart from the broad 0.8µm band and the short wavelength fall-off below 0.52µm, due to electronic transitions in the Cu^2+ ion, only 3 bands are present. By analogy with the spectrum of pure CuCO3, we assign all three at 2.29, 2.37 and 2.52µm to the CO3" radical. Some contribution to the 2.37µm band may come from OH', but no other hydroxyl bands are visible in the spectrum, a circumstance for which we have no explanation." Grain size fractions are indicated by the extension after the sample number: .1B = IMAGE_OF_SAMPLE:
- XRD Analysis
- Malachite - major component Possibility of some Mcguinnessite cannot be ruled out Trace of undetermined phase Konnert, Judith and Marta Flohr, 1992, unpublished data, USGS Reston, VA.
- X Units
- cm⁻¹
- Y Units
- Absorbance
- Data Points
- 1,801
Download
Attribution
USGS Spectral Library Version 7, U.S. Geological Survey
License: Public Domain
DOI: 10.3133/ds1035Analyze in Workbench
Open this spectrum in the SpectralBench workbench for advanced analysis, peak detection, and comparison.
Open Workbench