Marsh sediment DWV3-0511 dry
Marsh sediment DWV3-0511 dry — NIR2,126 points · 4000–12500 cm⁻¹
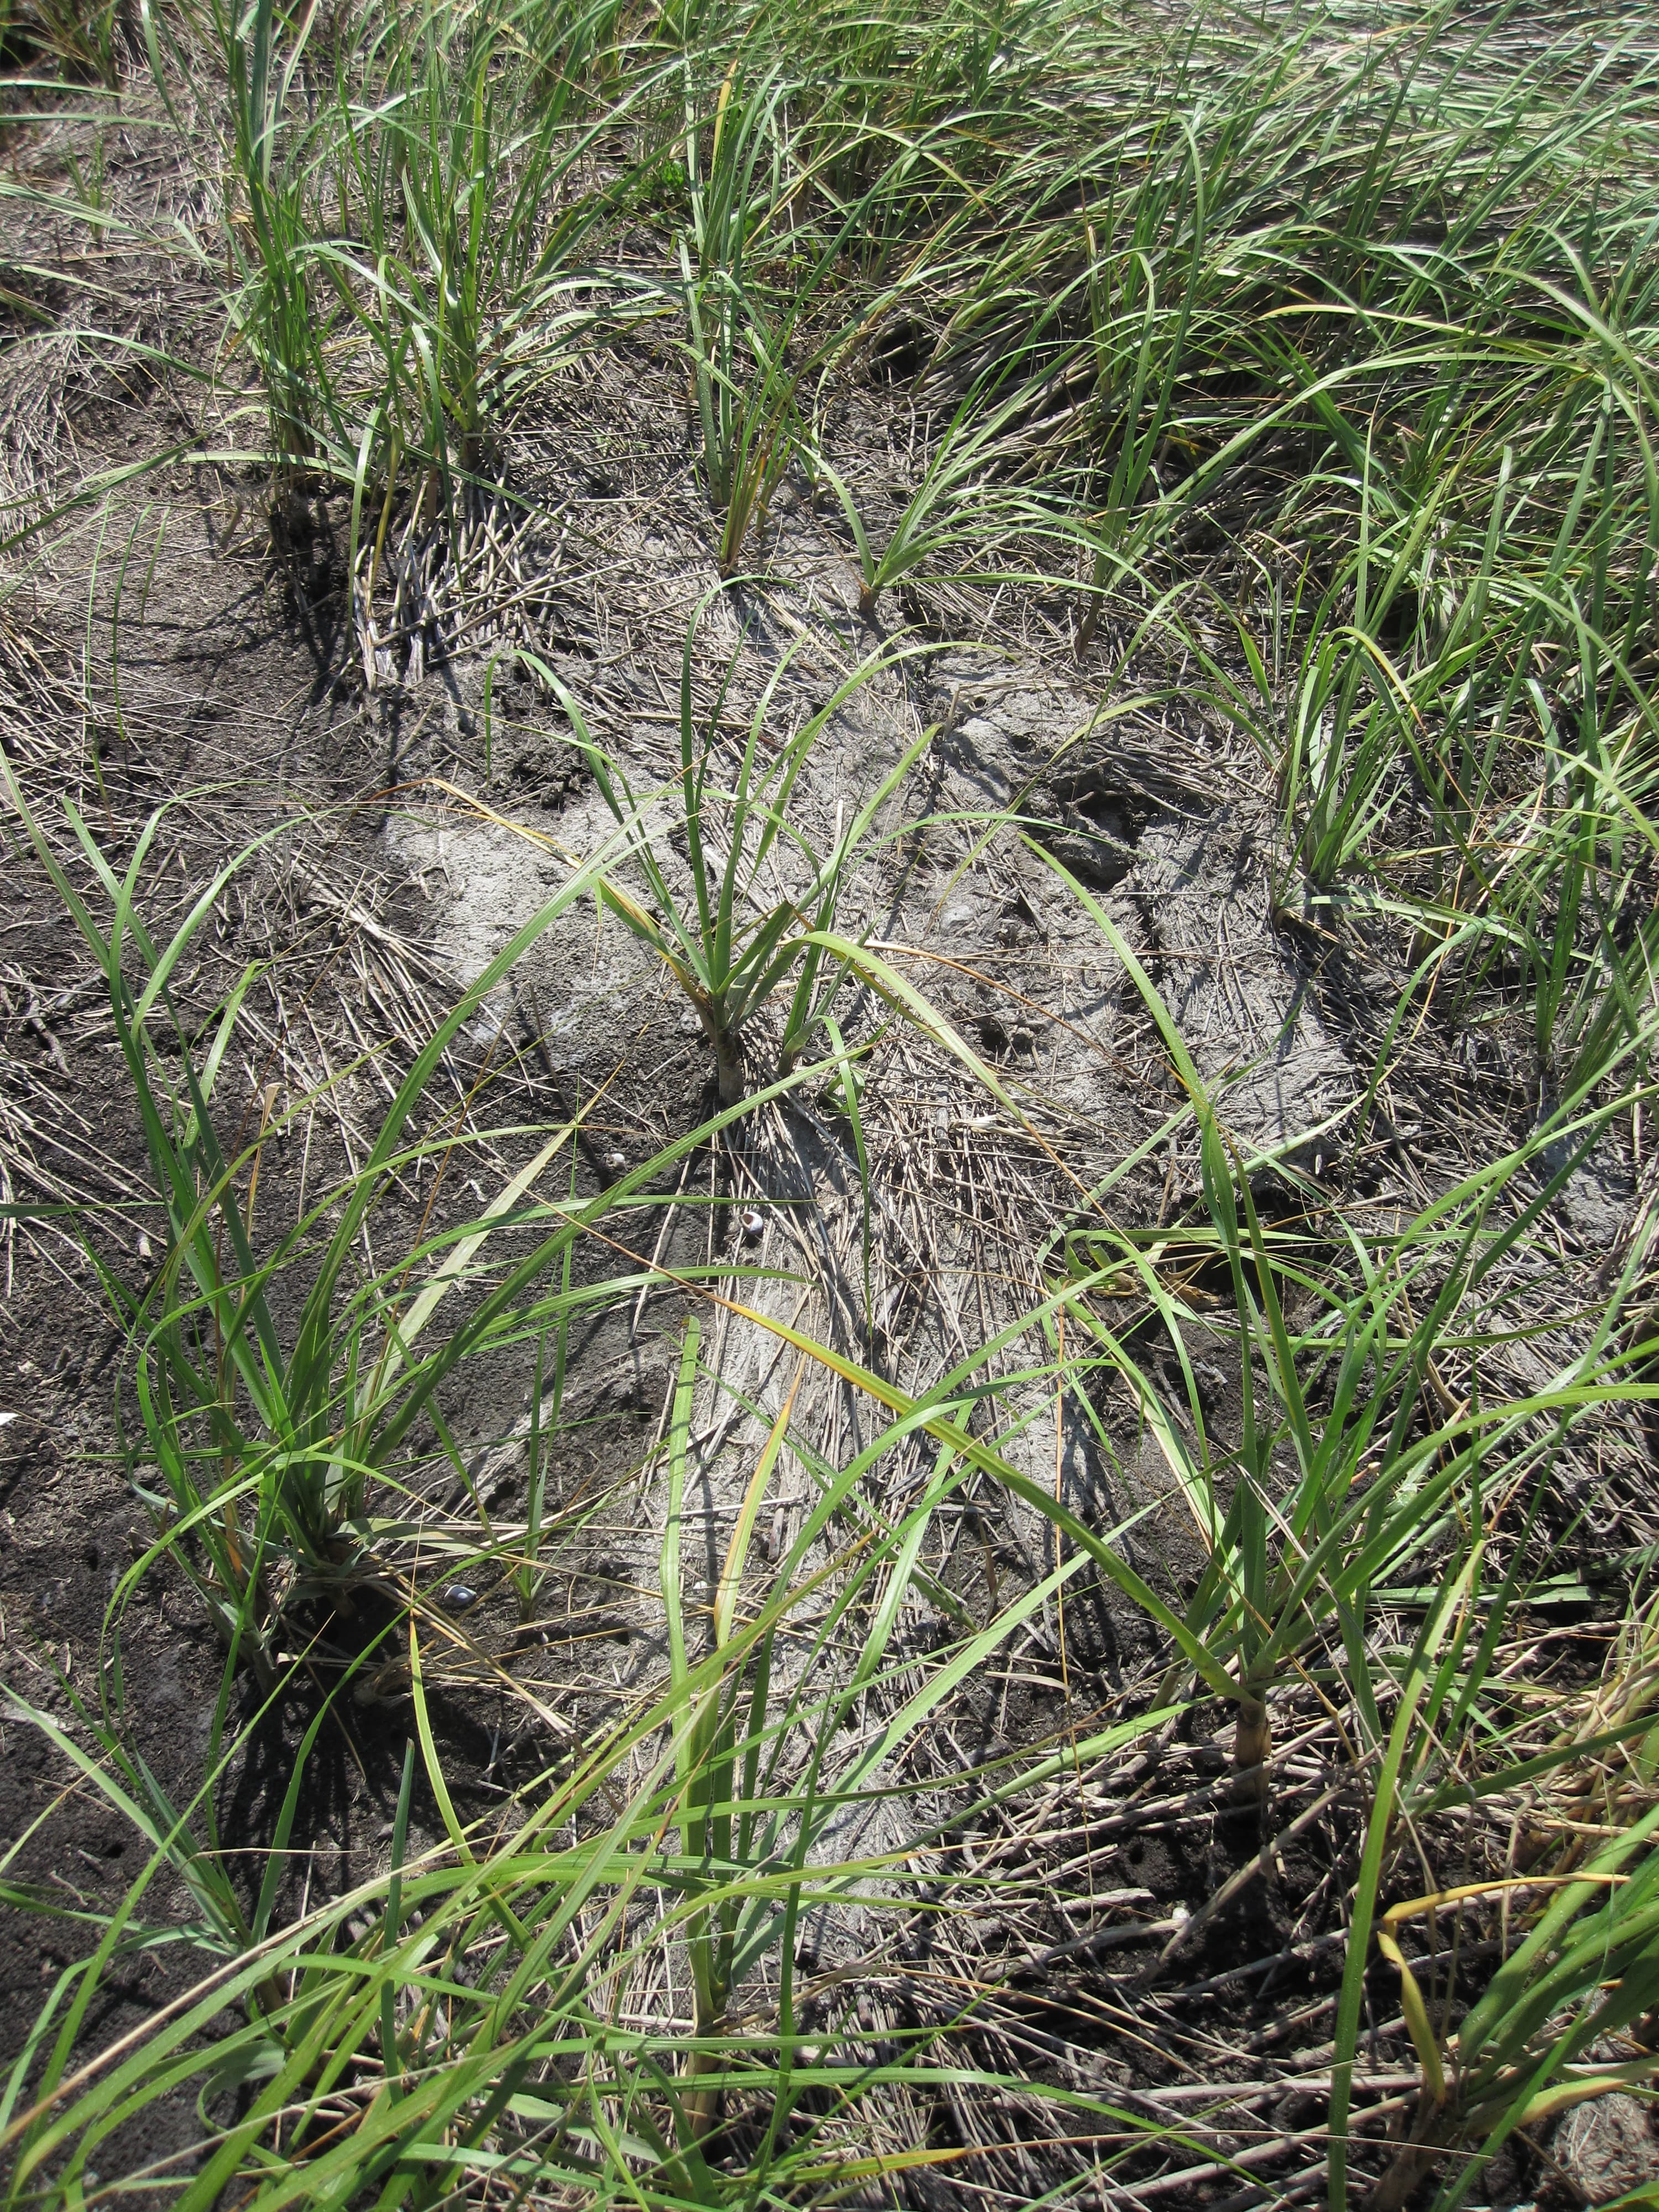
Sample photograph — USGS Spectral Library v7
Spectrum Details
- Modality
- NIR
- Category
- vegetation
- Material Type
- PLANT
- Sample ID
- marsh sediement at DWV3-0511
- Collection Locality
- Northern Barataria Bay, approximately 58 km south-southeast of New Orleans, Louisiana
- Spectral Purity
- 1a2_3_4_ # 1= 0.2-3, 2= 1.5-6, 3= 6-25, 4= 20-150 microns
- Sample Description
- This spectrum is the average reflectance of 10 field measurements of dry sediment on the surface of the marsh. Litter from adjacent vegetation was removed prior to measurement. The vegetation cover around the bare surface consisted of black needlerush (Juncus roemerianus) and smooth cordgrass (Spartina alterniflora). The measurements were made on May 11, 2011. These spectra were made using an ASD Field Spectrometer 3 (FS3) in reflectance mode, relative to a Spectralon reference panel. During the recording of the spectra, the fiber optic was held approximately 15 cm above the ground and moved around to different areas of exposed marsh sediment. An average spectrum was computed from the recorded measurements. The average spectrum was converted to absolute reflectance by multiplying by the reflectance spectrum of the Spectralon reference panel. Project Background This site was measured as part of joint work between the USGS Denver Spectroscopy Laboratory and the Coastal Restoration Assessment Branch of the USGS National Wetlands Research Center, Baton Rouge. This spectrum was used in the following publication: Kokaly, R.F., Couvillion, B.R., Holloway, J.M., Roberts, D.A., Ustin, S.L., Peterson, S.H., Khanna, S., and Piazza, S.C., 2013, Spectroscopic remote sensing of the distribution and persistence of oil from the Deepwater Horizon spill in Barataria Bay marshes, Remote Sensing of Environment, Volume 129, Pages 210-230. http://dx.doi.org/10.1016/j.rse.2012.10.028 IMAGE_OF_SAMPLE:
- X Units
- cm⁻¹
- Y Units
- Absorbance
- Data Points
- 2,126
Download
Attribution
USGS Spectral Library Version 7, U.S. Geological Survey
License: Public Domain
DOI: 10.3133/ds1035Analyze in Workbench
Open this spectrum in the SpectralBench workbench for advanced analysis, peak detection, and comparison.
Open Workbench