Marsh water40%...
Marsh water40%... — NIR2,126 points · 4000–12500 cm⁻¹
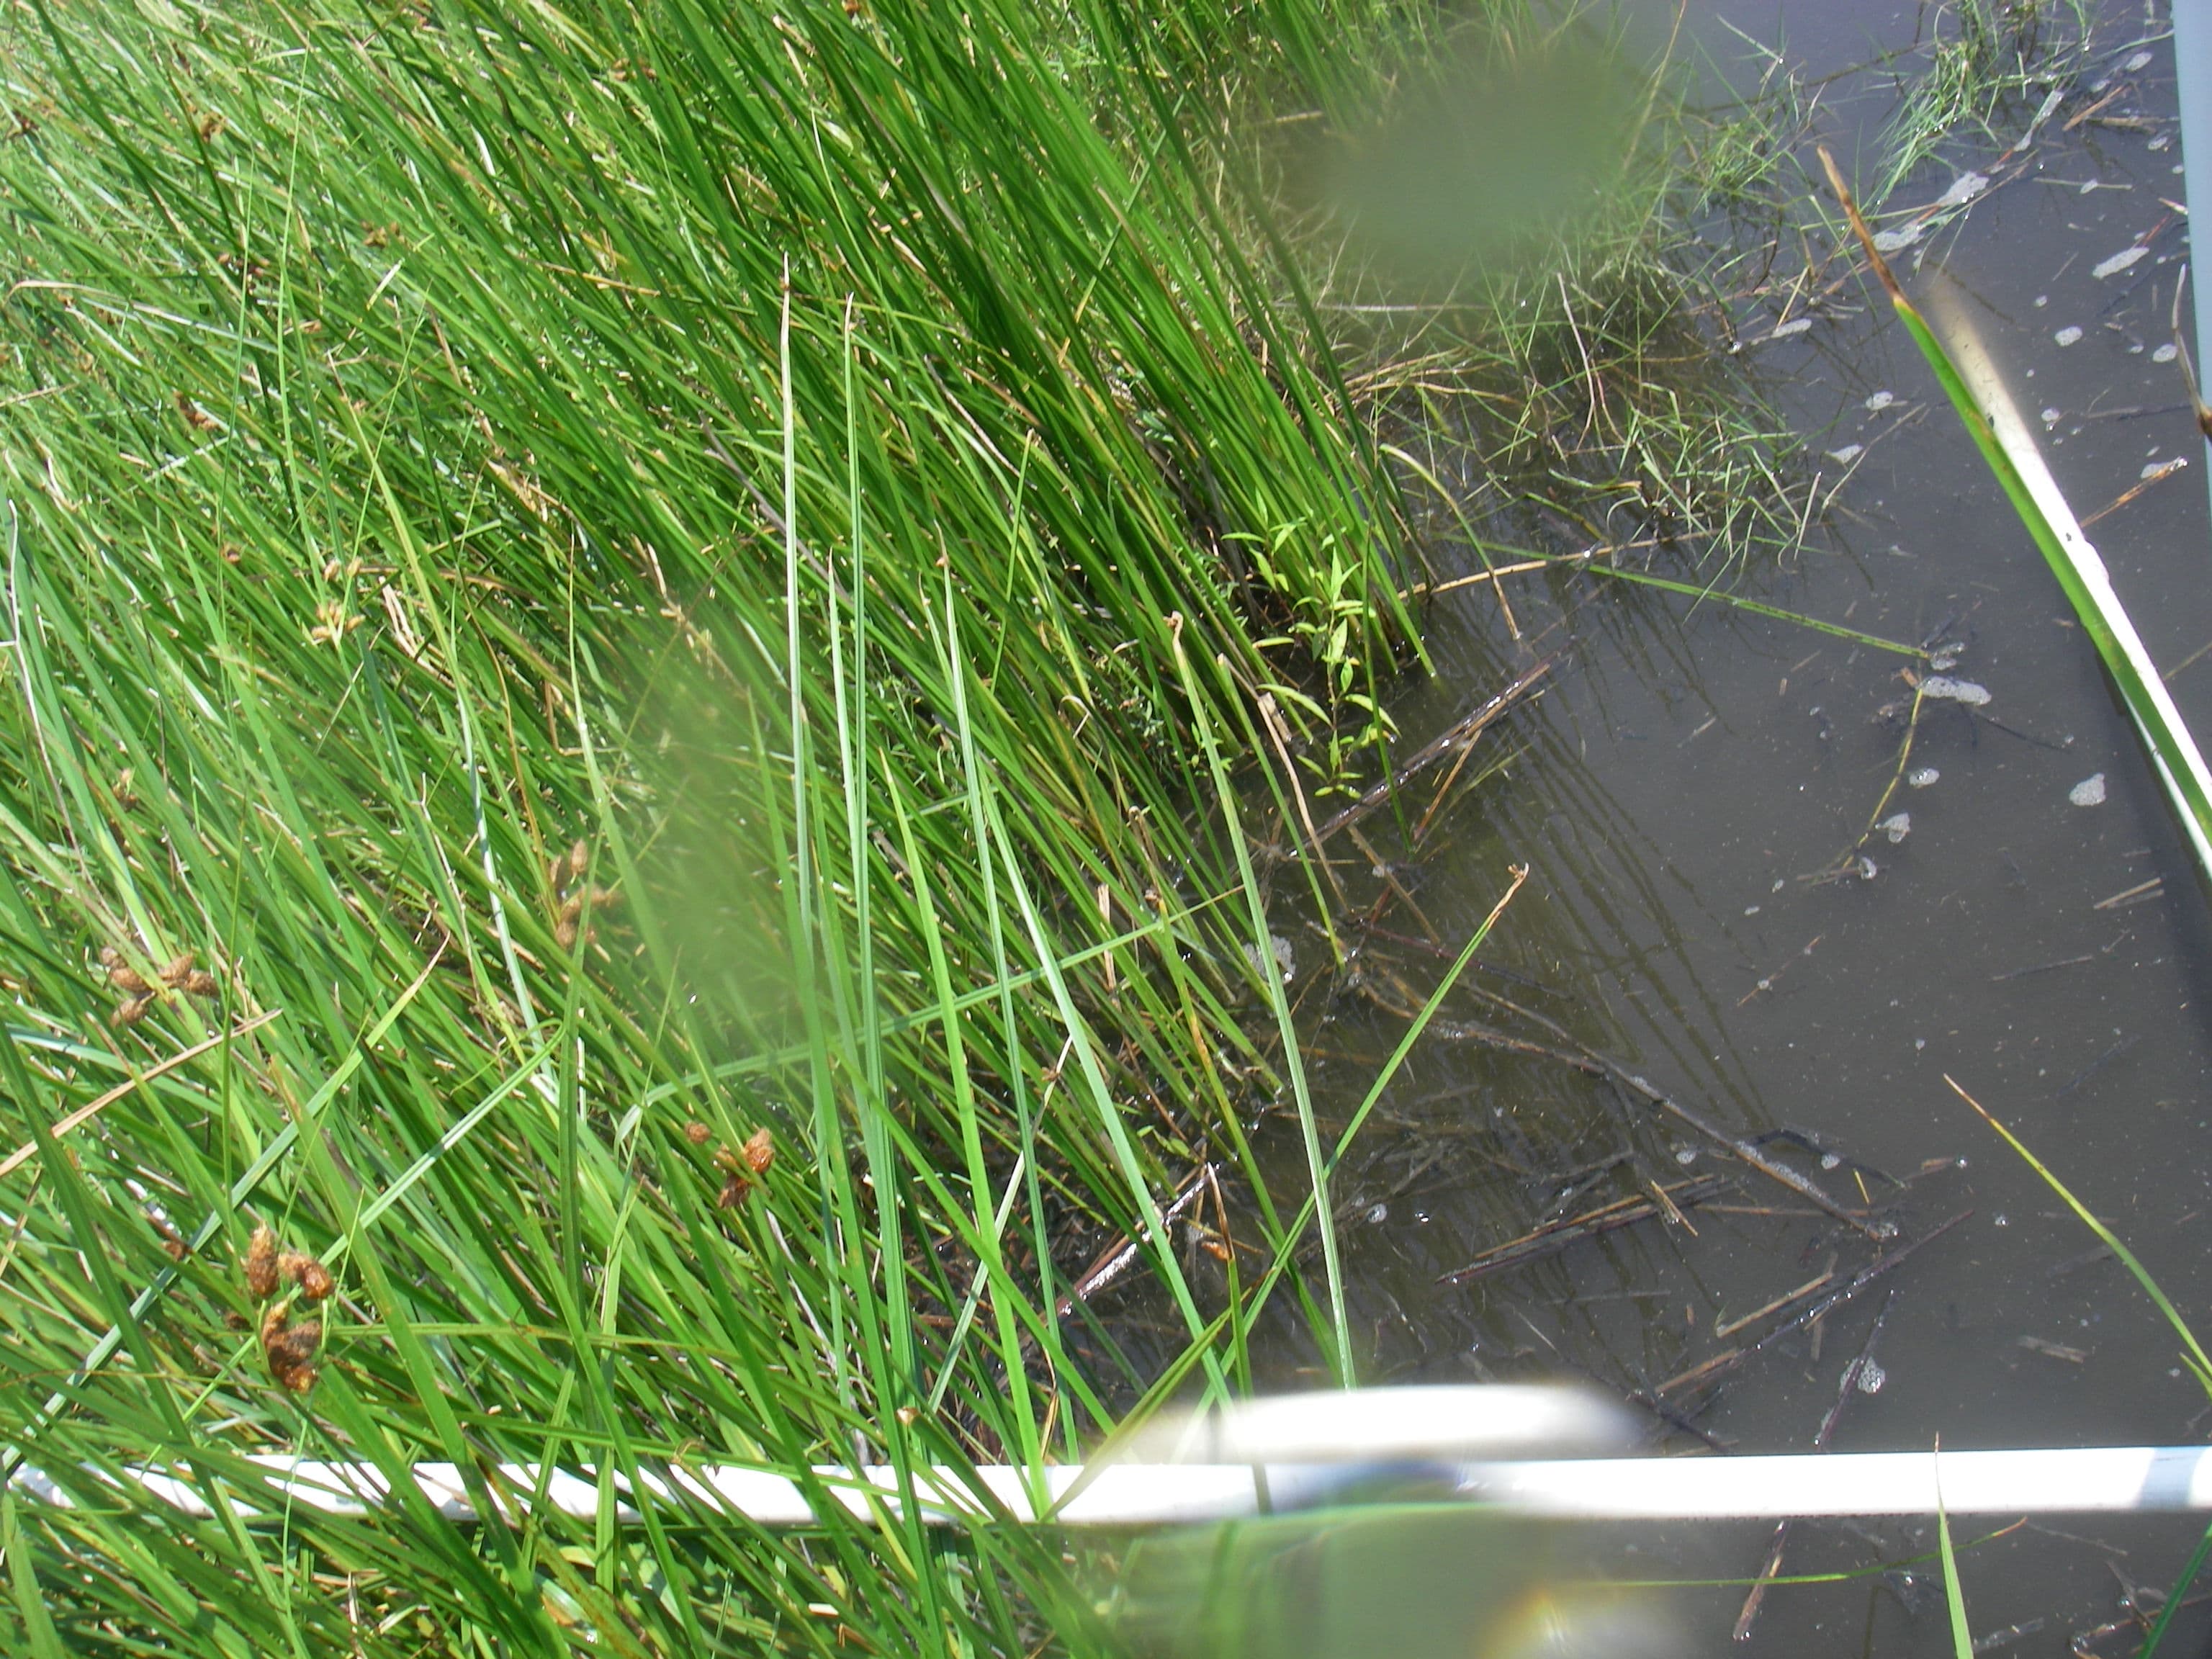
Sample photograph — USGS Spectral Library v7
Spectrum Details
- Modality
- NIR
- Category
- vegetation
- Material Type
- PLANT
- Sample ID
- CRMS121v69
- Collection Locality
- Coastwide Reference Monitoring System (CRMS) site 121 subplot v69. CRMS121 is located in southern Louisiana, approximately 37 kilometers southeast of New Orleans, Louisiana,in the western part of the Breton Sound hydrologic basin on the coast of the Gulf of Mexico.
- Spectral Purity
- 1a2_3_4_ # 1= 0.2-3, 2= 1.5-6, 3= 6-25, 4= 20-150 microns
- Sample Description
- This spectrum is the average reflectance for a 2x2 m area of marsh covered by mixed species as detailed in the site vegetation description. Collection Date 08-Jun-2010 Site Vegetation Description The total vegetation cover on this site was 60%. The average height of herbaceous vegetation was 98 cm. The following table shows the percent cover by cover category: Cover Category, Sub-Category Cover (%) _____________________________ ____________________________ Vegetation, Total Cover 60 Vegetation, Tree 0 Vegetation, Shrub 0 Vegetation, Grass 55 Vegetation, Forb 5 Non-vegetation, Total Cover 40 Non-vegetation, Litter 0 Non-vegetation, Bare 0 Non-vegetation, Water 40 Non-vegetation, Other 0 _____________________________ ____________________________ The following table shows the cover by shrub species in the plot: Shrub Species Cover (%) _____________________________________ ____________ none _____________________________________ ____________ The following table shows the cover by grass species in the plot: Grass Species Cover (%) ____________________________________________________________________ _____________ Schoenoplectus americanus (Pers.) Volk. ex Schinz & R. Keller 30 Schoenoplectus robustus (Pursh) M.T. Strong 21 Paspalum vaginatum Sw. 4 ____________________________________________________________________ _____________ The following table shows the cover by forb species in the plot: Forb Species Cover (%) _____________________________________ _____________ Polygonum punctatum Ell. 4 _____________________________________ _____________ Field Observations Unvegetated surface is 40% flooded bare ground. Water level is 0.26 ft above marsh. Site Classification The area has been predominantly classified as intermediate marsh (see http://lacoast.gov/crms2/home.aspx). Plot Location, Dimensions, and Vegetation Sampling The coordinates of the southeast corner of the 2x2 m plot are 29.693194 N, 89.820450 W (in decimal degrees, datum is NAD83). Within the plot, vegetation species were identified and the percent cover of each species was visually estimated. Spectral Measurement and Processing Methods This spectrum is the average of 20 spectral measurements recorded throughout the plot. These spectra were collected using an ASD Field Spectrometer 3 (FS3) in reflectance mode, relative to a Spectralon reference panel. While walking on the edges of the plot, the fiber optic cable was pointed at nadir (straight down) at approximately shoulder height. The instrument was programmed to record 6 second averages of reflectance (thus, each recorded spectrum was an average of 60 individual measurements). The average spectrum was converted to absolute reflectance by multiplying by the reflectance spectrum of the Spectralon reference panel. The following channels were deleted from the spectrum (set to a value of -1.23e+34) because of atmospheric contamination or high levels of noise: 410-420, 768-796, 1002-1100, 1447-1622, 1651-1669, and 2077-2151 corresponding to wavelengths 0.759-0.769, 1.117-1.145, 1.351-1.449, 1.796-1.971, 2.000-2.018, and 2.426-2.500 General Site Description The plot is located in southern Louisiana, approximately 37 kilometers southeast of New Orleans, Louisiana. It is in the western part of the Breton Sound hydrologic basin on the coast of the Gulf of Mexico. For additional information on the CRMS site see http://lacoast.gov/crms2/home.aspx Project Background This site was measured as part of joint work between the USGS Denver Spectroscopy Laboratory and the Coastal Restoration Assessment Branch of the USGS National Wetlands Research Center, Baton Rouge. This spectrum was used in the following publication: Kokaly, R.F., Couvillion, B.R., Holloway, J.M., Roberts, D.A., Ustin, S.L., Peterson, S.H., Khanna, S., and Piazza, S.C., 2013, Spectroscopic remote sensing of the distribution and persistence of oil from the Deepwater Horizon spill in Barataria Bay marshes, Remote Sensing of Environment, Volume 129, Pages 210-230. http://dx.doi.org/10.1016/j.rse.2012.10.028 IMAGE_OF_SAMPLE: in the site layout diagram, the subplot location is indicated by the matching number within the parentheses
- X Units
- cm⁻¹
- Y Units
- Absorbance
- Data Points
- 2,126
Download
Attribution
USGS Spectral Library Version 7, U.S. Geological Survey
License: Public Domain
DOI: 10.3133/ds1035Analyze in Workbench
Open this spectrum in the SpectralBench workbench for advanced analysis, peak detection, and comparison.
Open Workbench