Praseodymium Oxide — NIR2,126 points · 4000–12500 cm⁻¹
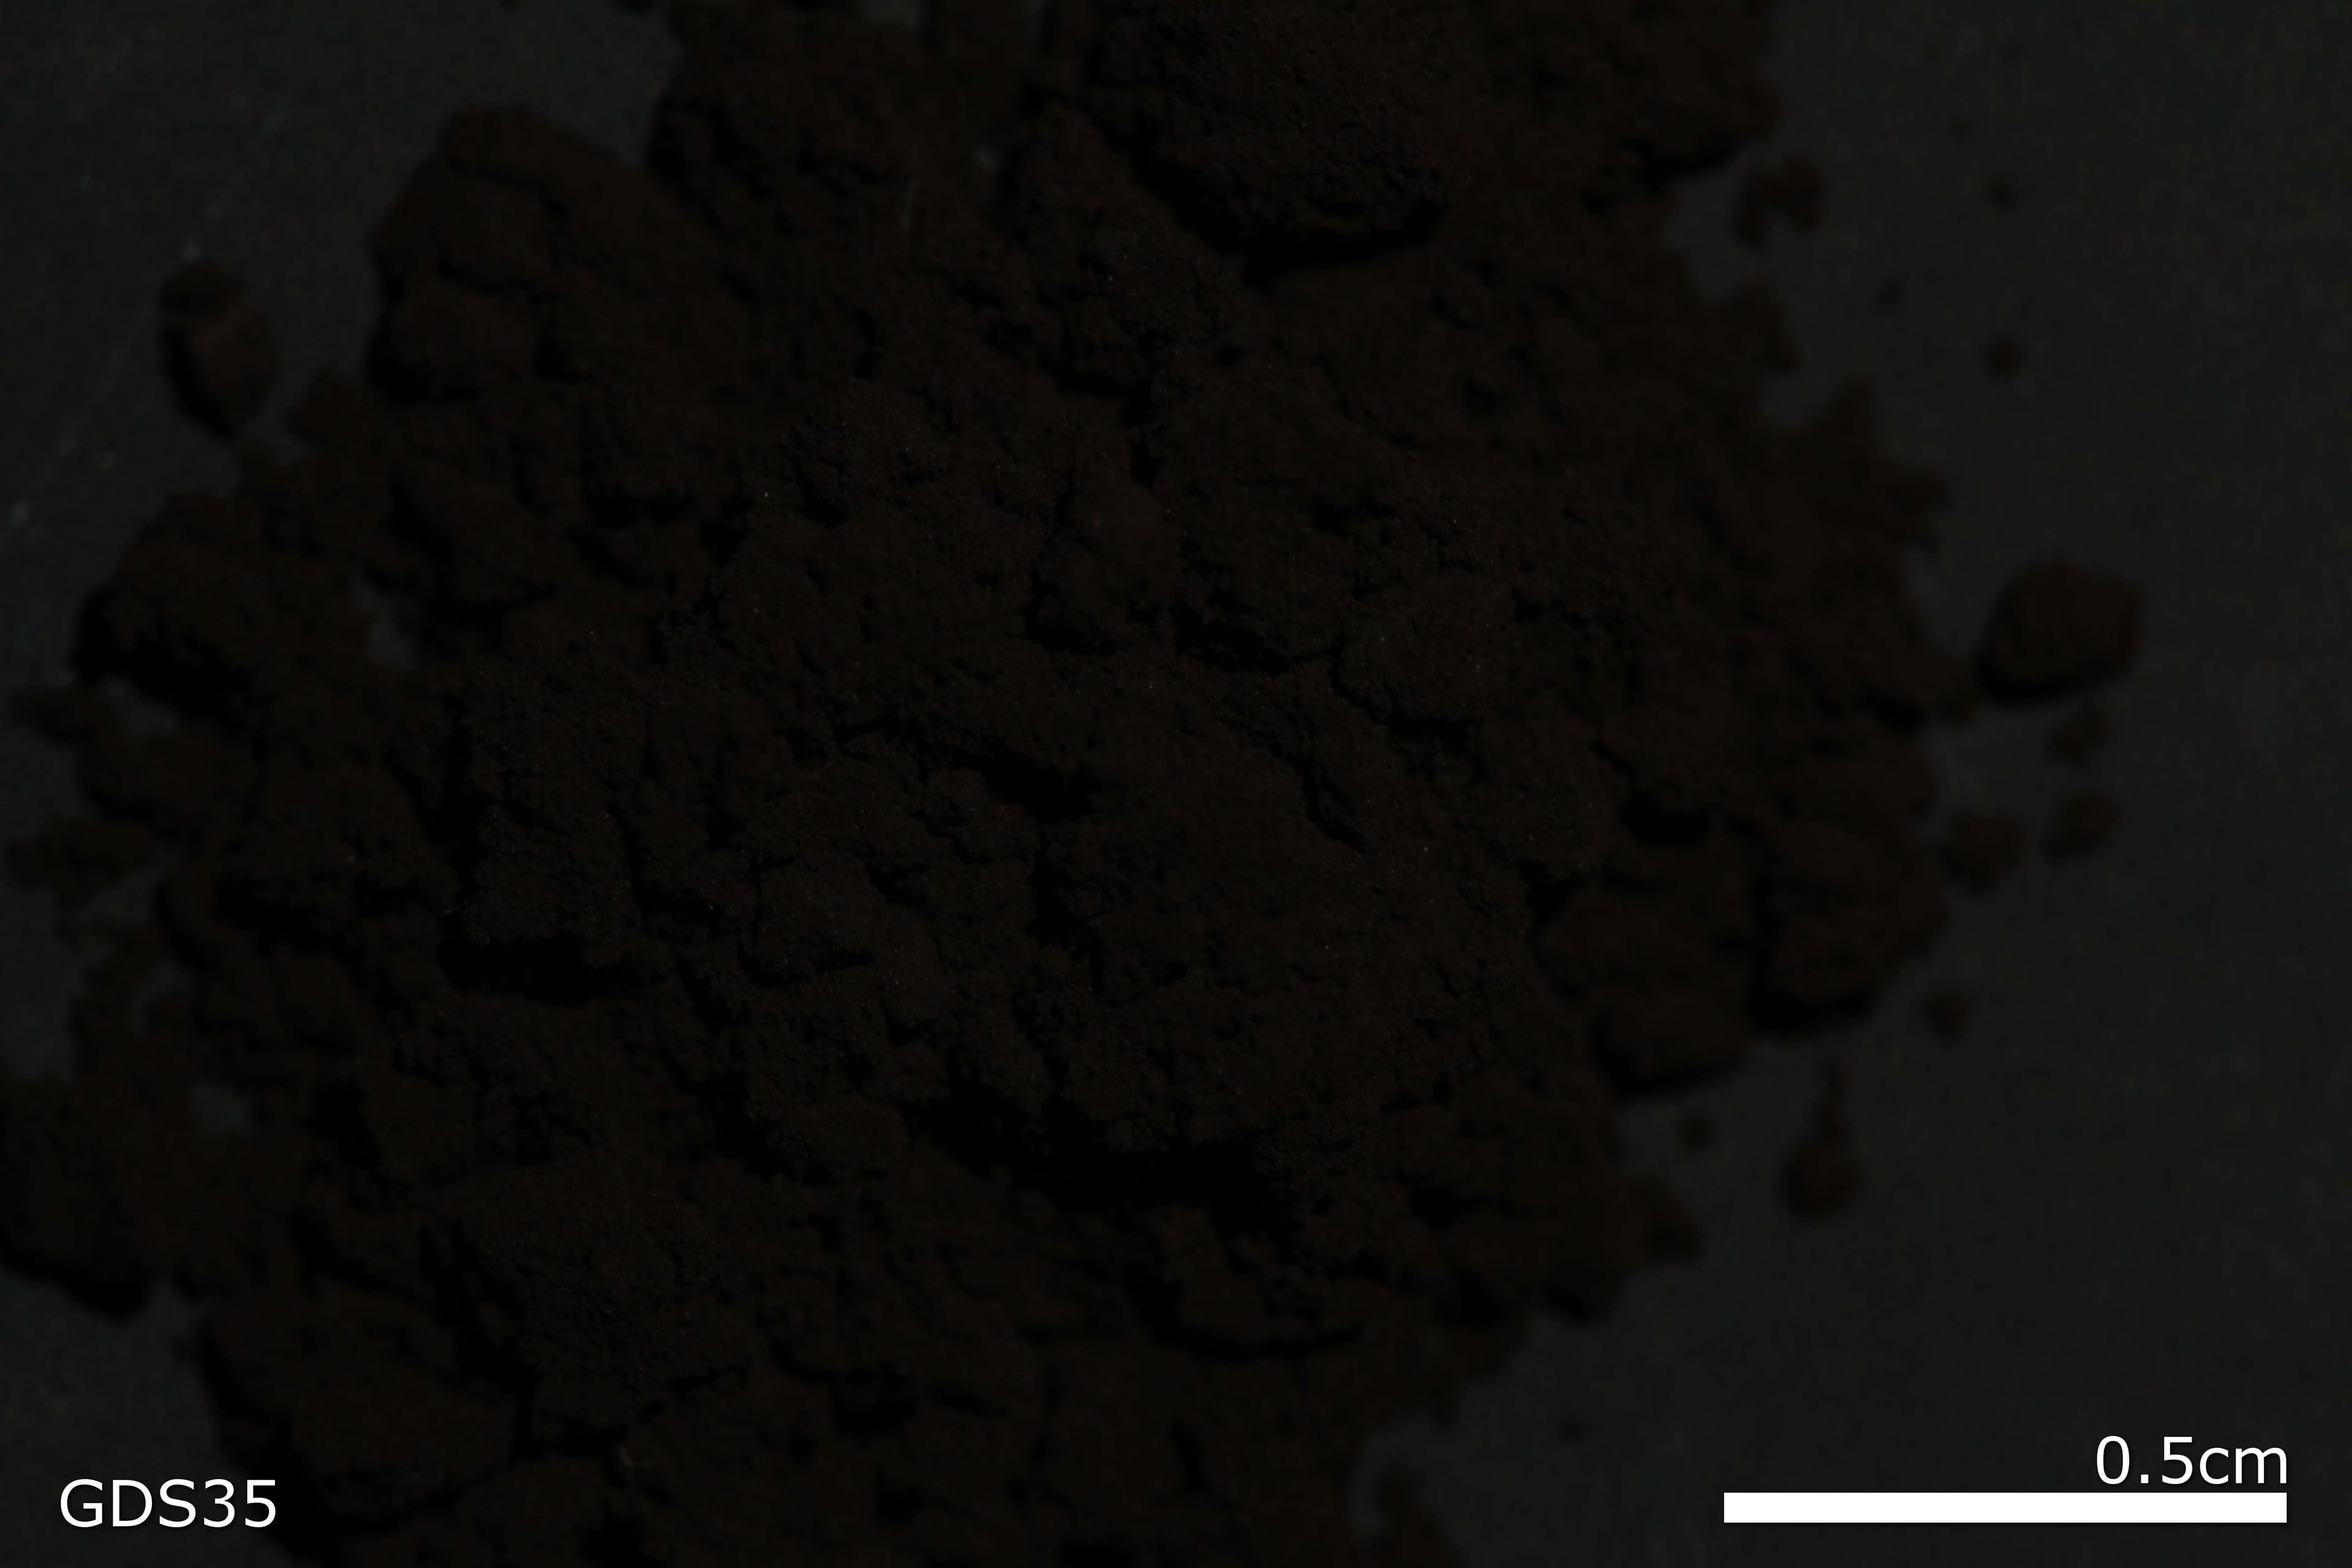
Sample photograph — USGS Spectral Library v7
Spectrum Details
- Modality
- NIR
- Category
- man-made
- Material Type
- Oxide
- Sample ID
- GDS35
- Collection Locality
- REE Standard 81.6% Pr Lot No. 05791
- Spectral Purity
- 1c2b3b4_ # 1= 0.2-3, 2= 1.5-6, 3= 6-25, 4= 20-150 microns
- Composition / XRD
- None # XRF, EPMA, ICP(Trace), WChem COMPOSITION_TRACE:
- Sample Description
- Spex standard 81.6% Pr Lot No. 05791 Reflectance spectra for reagent-grade Eu2O3, Nd2O3, Sm2O3, and Pr2O3 show the intense, narrow absorption bands caused by electronic transitions in trivalent rare earth elements (White, 1967; Dieke and Crosswhite, 1963). The absorption patterns produced by each of these oxides is distinctive for the particular rare earth element involved. The positions of the major bands for Nd2O3 and Sm2O3 are indicated in Table 2. Absorption features that occur near 1.4 and 1.9 µ cannot be unambiguously assigned to water or hydroxyl since some rare earth element oxides, notably Sm2O3 and Pr2O3, have electronic bands in these wavelength regions. The cause of the 2.35µ bands in two of the rare earth element oxide samples also has not been determined. Although White (1967) tentatively attributed similar features to water, the bands could be produced by minor amounts of CO3 or possibly by an undocumented REE-OH vibrational overtone. No carbonate or hydroxyl-bearing phases were detected by X-ray diffraction analysis of the rare earth element oxide samples. Rowan, Lawrence C., Kingston, Marguerite J., Crowley, James K., Spectral Reflectance of Carbonatites and Related Alkalic Igneous Rocks: Selected Samples from Four North American Localities, Economic Geology, Vol 81, 1986, pp. 857-871. IMAGE_OF_SAMPLE: Sample is dark so is difficult to see in this photo.
- XRD Analysis
- 40 kV - 30 mA, 6.5-9.5 keV File: prox35,mdi (smear mount on quartz plate) References: JCPDS #24-1006, 22-0848, 40-08240, 45-11740 Found: PrO2 Cubic; Eight unindexed reflections at 3.23, 2.80. 2.24, 2.11, 1.87, 1.84, 1.83 and 1.44 Angstroms. Comment: The dominant phase has strong narrow peaks but poor resolution of alpha1-alpha2. The cell face-centered cubic with a=5.39 Angstroms; peak positions and intensities match those in JCPDS #24-1006. The unindexed reflections are moderately weak to weak, broad, poorly formed, and do not resolve alpha1-alpha2. Simple boolean search of the PDF database using Pr composition and the two strongest unindexed reflections (at 3.23 and 2.24 Angstroms) suggests that K3PrF6 and K2PrF5 (which have peaks that overlap those of cubic PrO2) may be contaminants.
- X Units
- cm⁻¹
- Y Units
- Absorbance
- Data Points
- 2,126
Download
Attribution
USGS Spectral Library Version 7, U.S. Geological Survey
License: Public Domain
DOI: 10.3133/ds1035Analyze in Workbench
Open this spectrum in the SpectralBench workbench for advanced analysis, peak detection, and comparison.
Open Workbench