Andalusite NMNHR17898 lggr — FTIR1,801 points · 400–4000 cm⁻¹
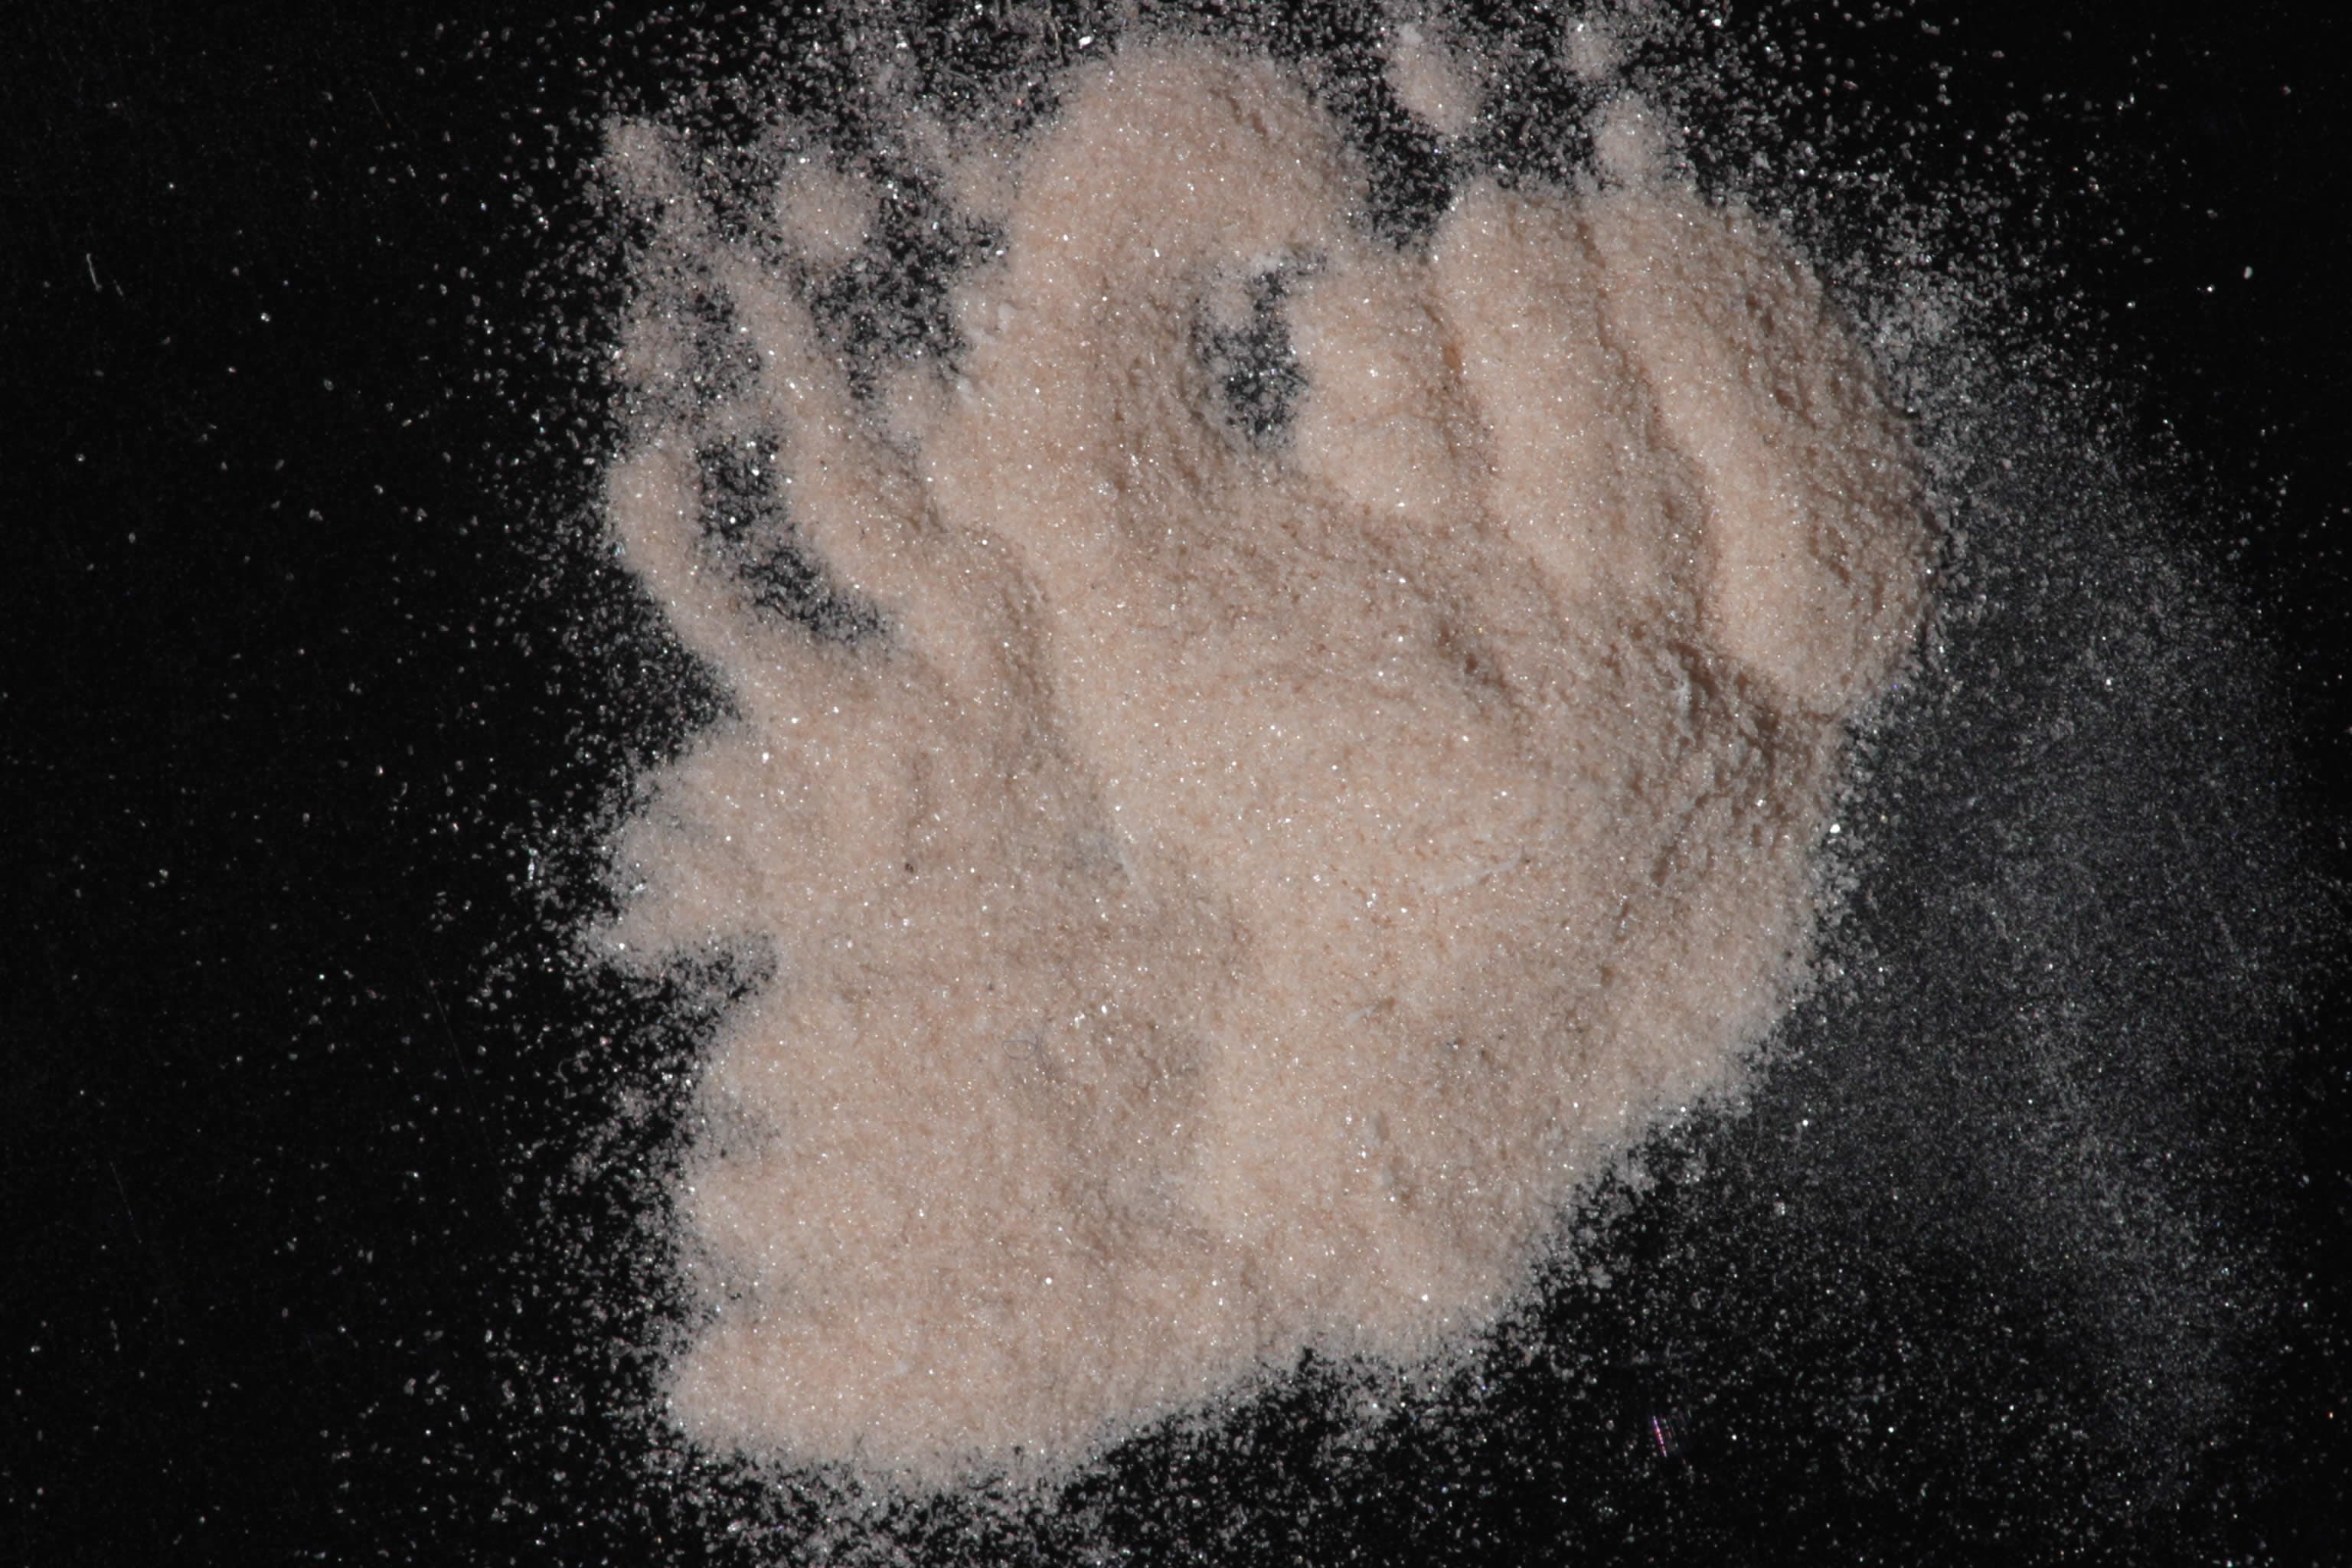
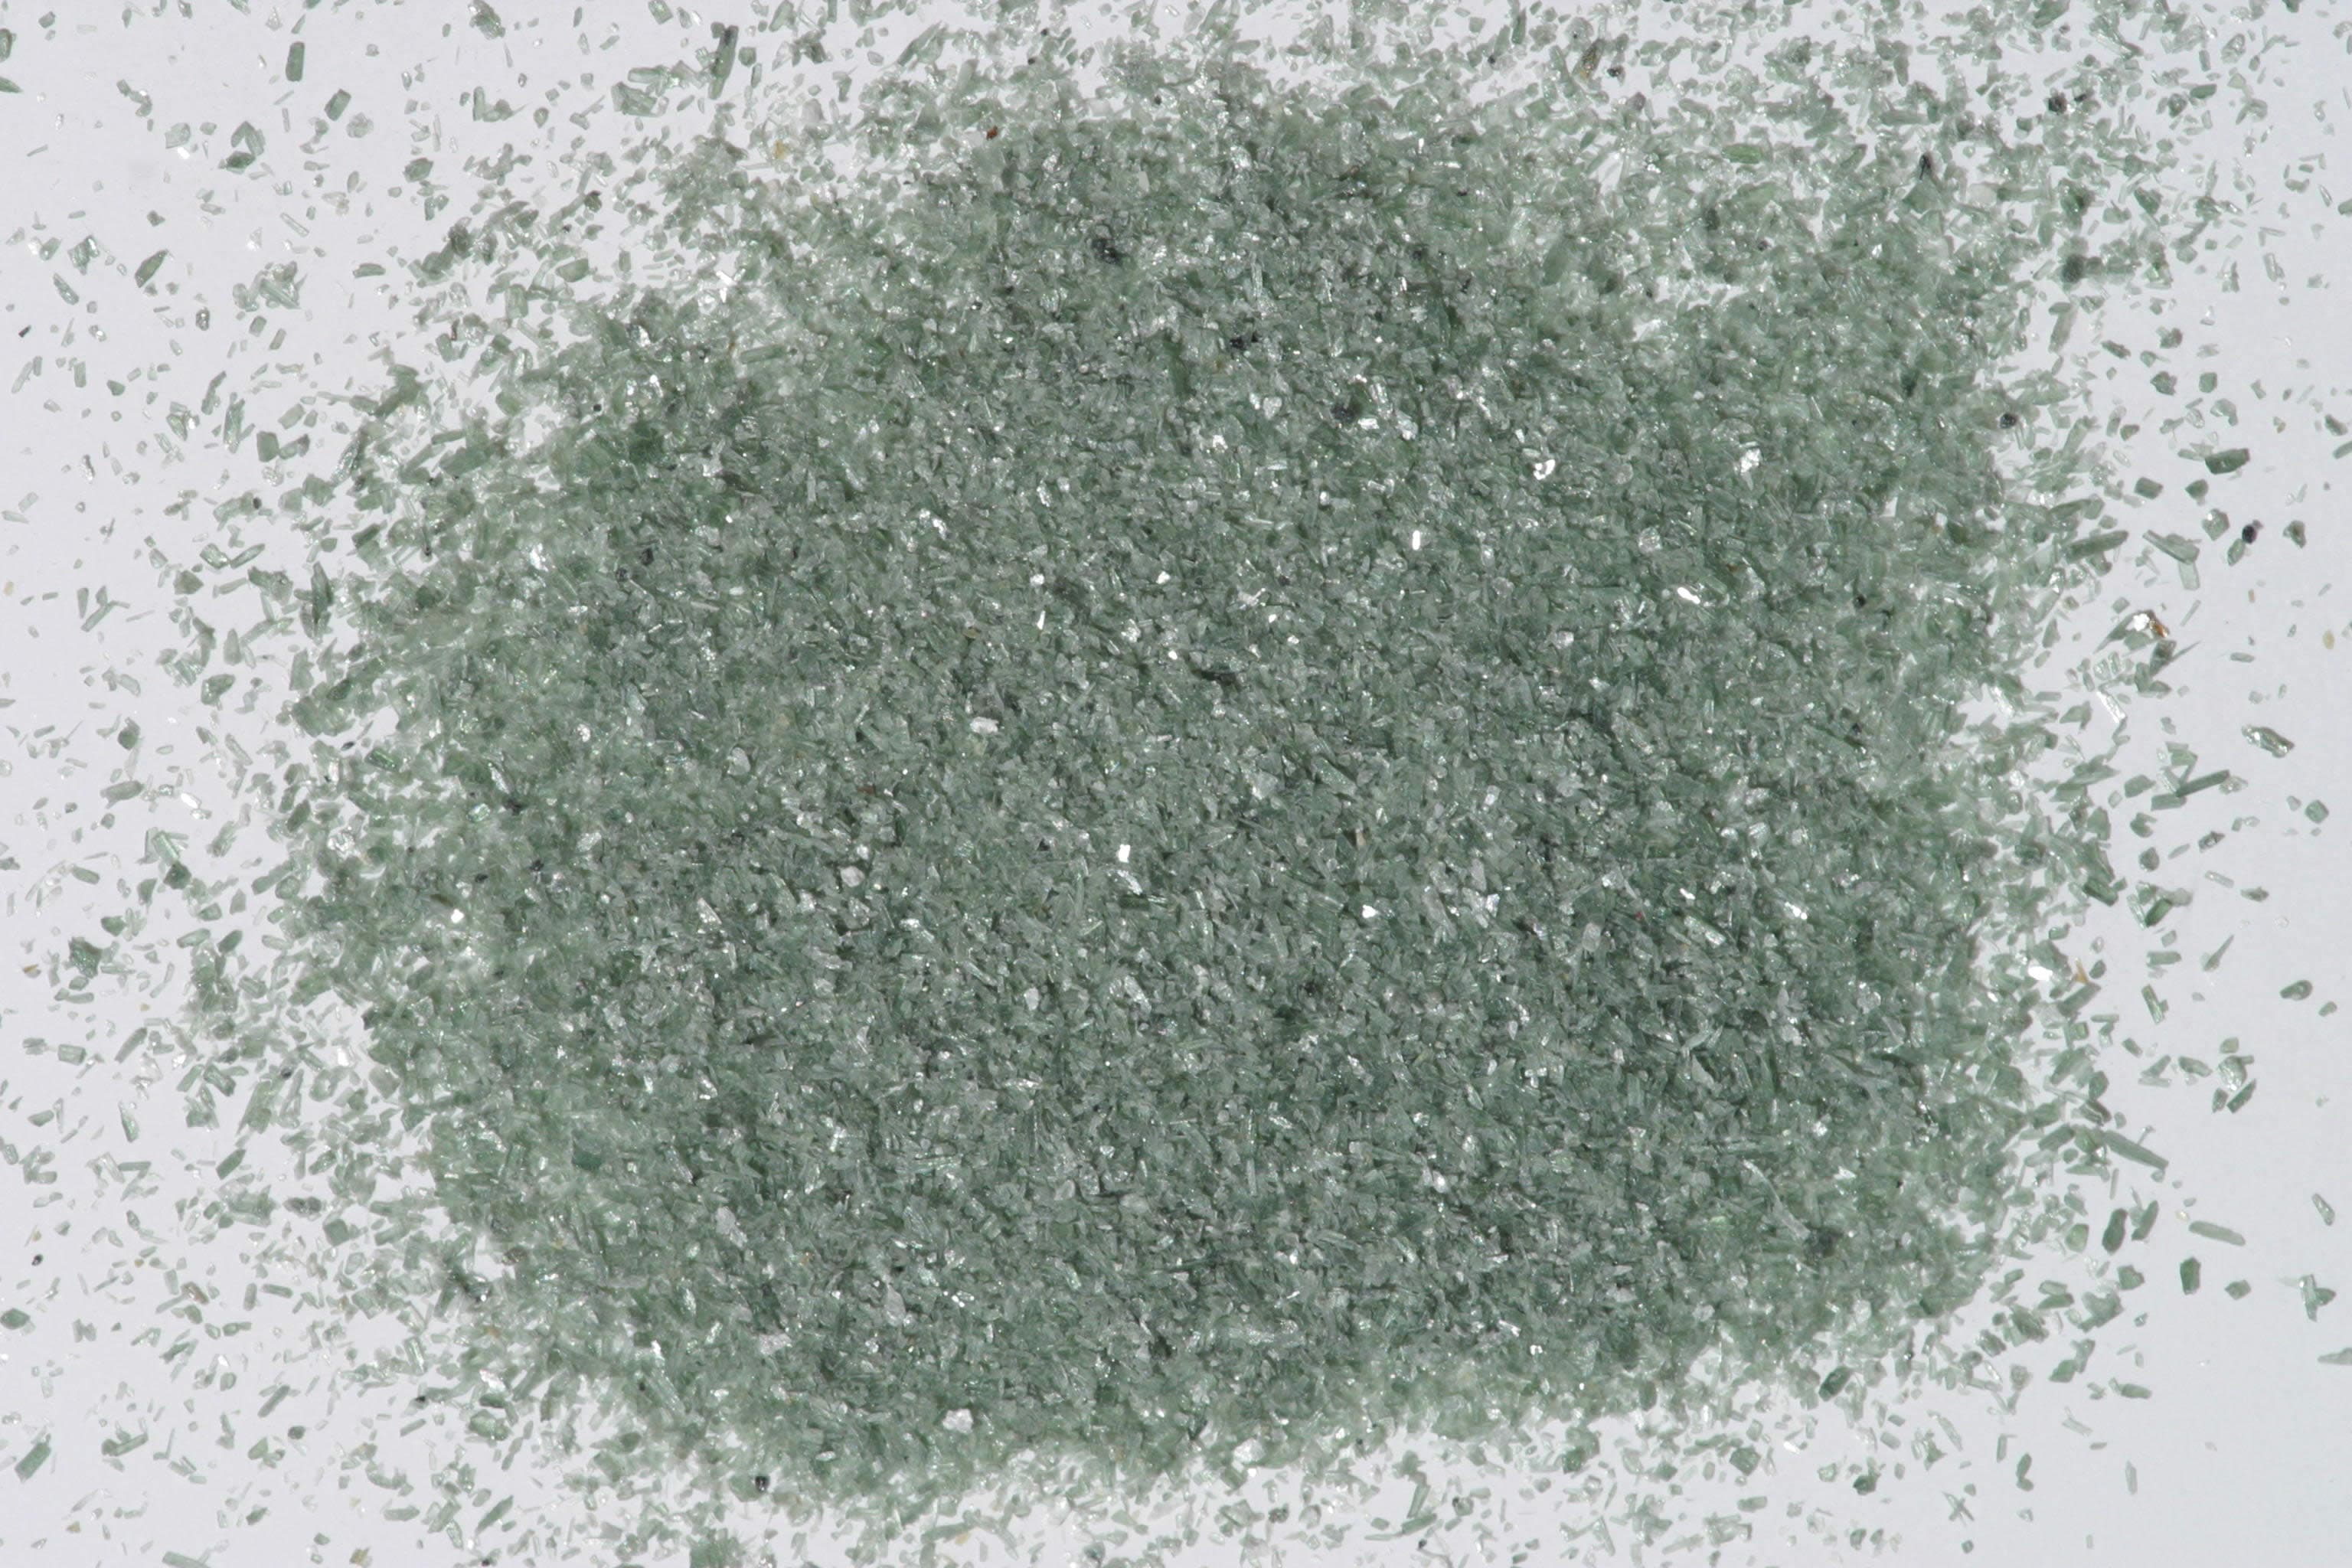
Sample photograph — USGS Spectral Library v7
Spectrum Details
- Modality
- FTIR
- Category
- mineral
- Material Type
- Nesosilicate
- Sample ID
- NMNH17898
- Collection Locality
- St. Theresa, Espirito Santo, Brazil
- Spectral Purity
- 1c2_3_4_ # NMNHR17898 # 1= 0.2-3, 2= 1.5-6, 3= 6-25, 4= 20-150 microns SPECTRAL_PURITY: 1_2c3b4_ # NMNHR17898
- Composition / XRD
- EM # XRF, EPMA, ICP(Trace), WChem
- Sample Description
- Forms series with Kanonaite. Trimorphous with Kyanite and Sillimanite. The structure consists of chains of AlO6 octahedra parallel to c, cross-linked by SiO4 tetrahedra and AlO5 polyhedra. Andalusite is typically formed in the contact aureoles of igneous intrusions in argillaceous rocks. "Results of petrographic examination: Sample is composed of two crystals, one clear and one pale pink. Both appear pure, both 1 x 0.5 cm. Examination under petrographic microscope indicates pure and clean sample. Sample grains chosen for microprobe analysis are clear but with poor polish in part. " Salisbury, J. W., Walter, L. W., and Vergo, N., 1987, Mid-Infrared (2.1-25µm) Spectra of Minerals: First Edition, U.S. Geological Survey Open File Report 87-263. There are weak absorption features near 2.2 and 2.35 µm due to trace alteration not seen by other methods. -Roger N. Clark IMAGE_OF_SAMPLE:
- XRD Analysis
- Pure. (Norma Vergo) Pure.: Salisbury, J. W., Walter, L. W., and Vergo, N., 1987, Mid-Infrared (2.1-25µm) Spectra of Minerals: First Edition, U.S. Geological Survey Open File Report 87-263.
- X Units
- cm⁻¹
- Y Units
- Absorbance
- Data Points
- 1,801
Download
Attribution
USGS Spectral Library Version 7, U.S. Geological Survey
License: Public Domain
DOI: 10.3133/ds1035Match Your Spectrum
Have an unknown? Upload it and match against Andalusite NMNHR17898 lggr and thousands more references with HQI scoring.
Identify My Sample